Medical doctors (per 10,
HealthWHO GHOwho_gho:HWF_0001•Per 10,000 population•1990 → 2024•192 countries
Series quick facts
High-level context for this country series.
HealthWHO GHO
Coverage
192
Frequency
yearly
Range
1990 \u2192 2024
Latest
2024
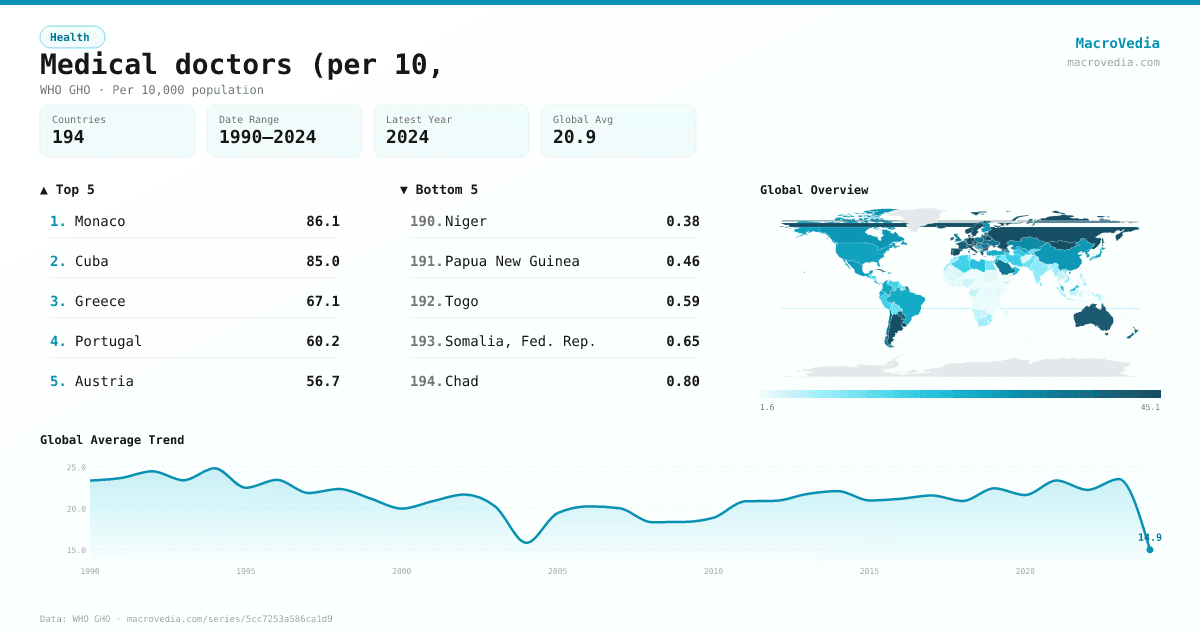
Medical doctors (per 10, by country
Latest available value per country (as of 2024)
Low \u2192 High
Unit: Per 10,000 population
≤ 2.07
2.07 – 5.59
5.59 – 12.82
12.82 – 23.02
23.02 – 31.57
31.57 – 42.08
> 42.08
No data
Generated by MacroVedia.comSource: World Health Organization (WHO GHO)
Highest 15 countries
Medical doctors (per 10,
50 countries with data
Generated by MacroVedia.comSource: World Health Organization (WHO GHO)
Distribution across countries
Medical doctors (per 10,
Countries
50
Median
42.8
Mean
45
25th pctl
37.7
75th pctl
47.2
Generated by MacroVedia.comSource: World Health Organization (WHO GHO)
Compare trends
Medical doctors (per 10,
AustriaIcelandIreland
Generated by MacroVedia.comSource: World Health Organization (WHO GHO)
| Country | Latest | Date | Trend |
|---|---|---|---|
| MonacoMCO | 86.09 Per 10,000 population | 2020 | |
| CubaCUB | 85.05 Per 10,000 population | 2022 | |
| GreeceGRC | 67.12 Per 10,000 population | 2023 | |
| PortugalPRT | 60.22 Per 10,000 population | 2023 | |
| AustriaAUT | 56.7 Per 10,000 population | 2024 | |
| GeorgiaGEO | 56.42 Per 10,000 population | 2023 | |
| ItalyITA | 53.06 Per 10,000 population | 2023 | |
| AndorraAND | 51.16 Per 10,000 population | 2024 | |
| Russian FederationRUS | 51.11 Per 10,000 population | 2022 | |
| ArgentinaARG | 50.88 Per 10,000 population | 2023 | |
| NorwayNOR | 49.75 Per 10,000 population | 2023 | |
| BelarusBLR | 47.96 Per 10,000 population | 2024 | |
| MaltaMLT | 47.19 Per 10,000 population | 2023 | |
| LithuaniaLTU | 46.45 Per 10,000 population | 2023 | |
| MongoliaMNG | 45.96 Per 10,000 population | 2024 | |
| GermanyDEU | 45.93 Per 10,000 population | 2023 | |
| IcelandISL | 45.78 Per 10,000 population | 2024 | |
| SwitzerlandCHE | 45.59 Per 10,000 population | 2023 | |
| UruguayURY | 45.51 Per 10,000 population | 2023 | |
| DenmarkDNK | 45.3 Per 10,000 population | 2023 | |
| SwedenSWE | 44.74 Per 10,000 population | 2022 | |
| SpainESP | 44.29 Per 10,000 population | 2023 | |
| San MarinoSMR | 44.05 Per 10,000 population | 2024 | |
| BulgariaBGR | 43.92 Per 10,000 population | 2023 | |
| Antigua and BarbudaATG | 43.18 Per 10,000 population | 2024 | |
| CzechiaCZE | 42.39 Per 10,000 population | 2023 | |
| St. LuciaLCA | 42.34 Per 10,000 population | 2020 | |
| AustraliaAUS | 42.28 Per 10,000 population | 2023 | |
| Trinidad and TobagoTTO | 41.57 Per 10,000 population | 2021 | |
| FranceFRA | 40.09 Per 10,000 population | 2023 | |
| IrelandIRL | 39.89 Per 10,000 population | 2024 | |
| CroatiaHRV | 39.73 Per 10,000 population | 2023 | |
| MoldovaMDA | 39.25 Per 10,000 population | 2023 | |
| IsraelISR | 39.22 Per 10,000 population | 2024 | |
| ParaguayPRY | 38.93 Per 10,000 population | 2022 | |
| NetherlandsNLD | 38.68 Per 10,000 population | 2023 | |
| CyprusCYP | 38.06 Per 10,000 population | 2023 | |
| New ZealandNZL | 37.72 Per 10,000 population | 2024 | |
| Slovak RepublicSVK | 37.61 Per 10,000 population | 2023 | |
| RomaniaROU | 37.12 Per 10,000 population | 2023 | |
| PolandPOL | 36.49 Per 10,000 population | 2023 | |
| SeychellesSYC | 36.34 Per 10,000 population | 2021 | |
| HungaryHUN | 35.87 Per 10,000 population | 2023 | |
| UkraineUKR | 35.31 Per 10,000 population | 2023 | |
| SloveniaSVN | 35.07 Per 10,000 population | 2023 | |
| ChileCHL | 34.9 Per 10,000 population | 2024 | |
| EstoniaEST | 34.9 Per 10,000 population | 2023 | |
| Saudi ArabiaSAU | 34.06 Per 10,000 population | 2023 | |
| BelgiumBEL | 33.91 Per 10,000 population | 2023 | |
| ArmeniaARM | 33.6 Per 10,000 population | 2022 |
Source: World Health Organization (WHO GHO)