Women making their own informed decisions regarding sexual relations, contraceptive use and reproductive health care …
DemographicsWB WDIwb_wdi:SG.DMK.SRCR.FN.ZS•% of women ages 15-49•2006 → 2022•69 countries
Series quick facts
High-level context for this country series.
DemographicsWB WDI
Coverage
69
Frequency
—
Range
2006 \u2192 2022
Latest
2022
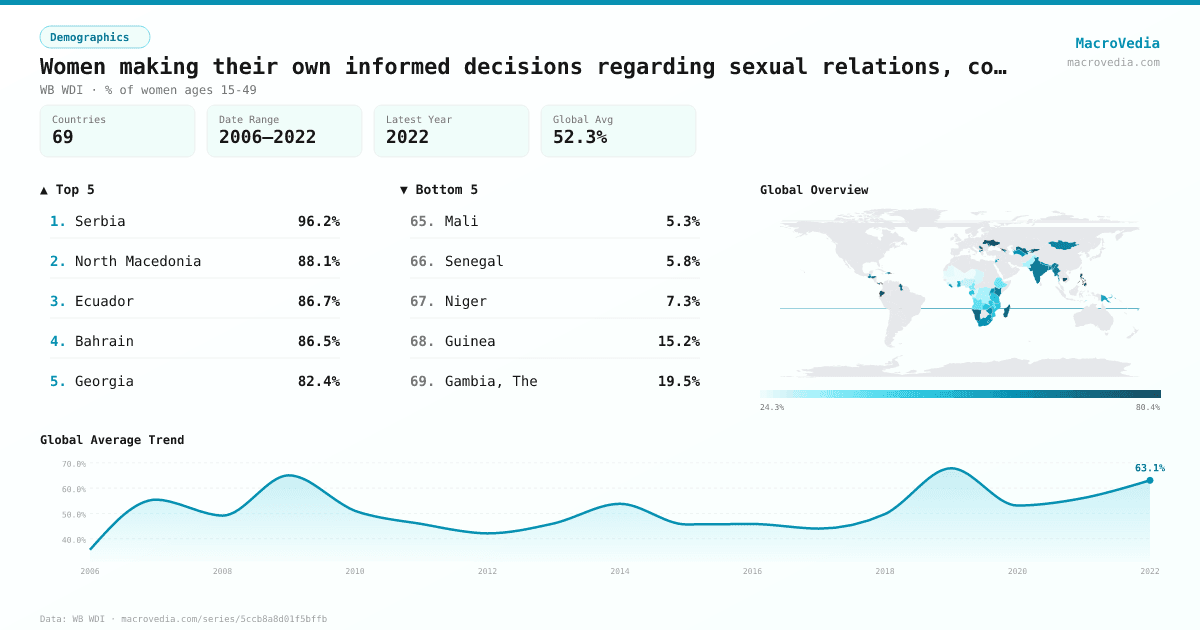
Women making their own informed decisions regarding sexual relations, contraceptive use and reproductive health care (% of women age 15- by country
Latest available value per country (as of 2022)
Low \u2192 High
Unit: %
≤ 27.17%
27.17% – 39.67%
39.67% – 50.97%
50.97% – 60.41%
60.41% – 64.8%
64.8% – 76.71%
> 76.71%
No data
Generated by MacroVedia.comSource: World Bank (WB WDI)
Highest 15 countries
Women making their own informed decisions regarding sexual relations, contraceptive use and reproductive health care (% of women age 15-
50 countries with data
Generated by MacroVedia.comSource: World Bank (WB WDI)
Distribution across countries
Women making their own informed decisions regarding sexual relations, contraceptive use and reproductive health care (% of women age 15-
Countries
50
Median
61.8%
Mean
63.7%
25th pctl
53.9%
75th pctl
72%
Generated by MacroVedia.comSource: World Bank (WB WDI)
Compare trends
Women making their own informed decisions regarding sexual relations, contraceptive use and reproductive health care (% of women age 15-
CambodiaNepalRwanda
Generated by MacroVedia.comSource: World Bank (WB WDI)
| Country | Latest | Date | Trend |
|---|---|---|---|
| SerbiaSRB | 96.2% | 2019 | — |
| North MacedoniaMKD | 88.1% | 2019 | — |
| EcuadorECU | 86.7% | 2018 | — |
| BahrainBHR | 86.5% | 2018 | — |
| GeorgiaGEO | 82.4% | 2018 | — |
| PhilippinesPHL | 82.3% | 2022 | |
| UkraineUKR | 81% | 2007 | — |
| CambodiaKHM | 80.3% | 2022 | |
| PanamaPAN | 79.1% | 2014 | — |
| Dominican RepublicDOM | 77% | 2007 | — |
| Kyrgyz RepublicKGZ | 76.6% | 2012 | — |
| MoldovaMDA | 72.9% | 2020 | — |
| MadagascarMDG | 72% | 2021 | |
| GuyanaGUY | 71.3% | 2009 | — |
| NamibiaNAM | 71.2% | 2013 | |
| UzbekistanUZB | 70.4% | 2022 | — |
| HondurasHND | 70.3% | 2012 | — |
| MyanmarMMR | 67.5% | 2016 | — |
| IndiaIND | 65.6% | 2021 | — |
| GuatemalaGTM | 64.8% | 2015 | — |
| KenyaKEN | 64.8% | 2022 | |
| BangladeshBGD | 63.8% | 2018 | — |
| MongoliaMNG | 63.2% | 2018 | — |
| NepalNPL | 62.6% | 2022 | |
| AlbaniaALB | 61.9% | 2018 | |
| ArmeniaARM | 61.8% | 2016 | |
| FijiFJI | 61.6% | 2021 | — |
| RwandaRWA | 61.3% | 2020 | |
| LesothoLSO | 60.9% | 2014 | |
| South AfricaZAF | 60.5% | 2016 | — |
| ZimbabweZWE | 59.9% | 2015 | |
| TurkmenistanTKM | 59.3% | 2019 | — |
| LiberiaLBR | 58.8% | 2020 | |
| UgandaUGA | 58.5% | 2016 | |
| JordanJOR | 58.2% | 2018 | |
| HaitiHTI | 57.1% | 2017 | |
| Papua New GuineaPNG | 56.7% | 2018 | — |
| MaldivesMDV | 53.9% | 2017 | — |
| GhanaGHA | 52% | 2014 | |
| NigeriaNGA | 50.8% | 2013 | |
| TanzaniaTZA | 49.6% | 2022 | |
| MozambiqueMOZ | 49.1% | 2011 | — |
| EswatiniSWZ | 48.9% | 2007 | — |
| GabonGAB | 48% | 2012 | — |
| ZambiaZMB | 46.5% | 2018 | |
| Sao Tome and PrincipeSTP | 46.2% | 2008 | — |
| MalawiMWI | 44.7% | 2016 | |
| Gambia, TheGMB | 40.5% | 2013 | — |
| BurundiBDI | 40.3% | 2017 | |
| AngolaAGO | 39.2% | 2016 | — |
Source: World Bank (WB WDI)