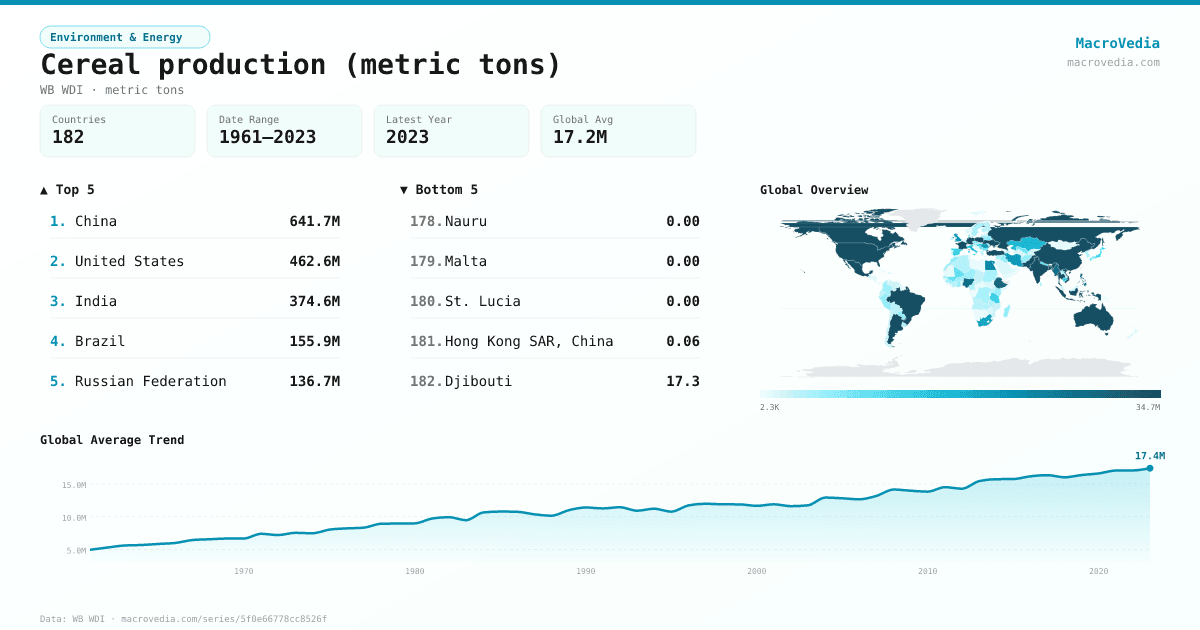
Cereal production (metric tons)
Environment & EnergyWB WDIwb_wdi:AG.PRD.CREL.MT•metric tons•1961 → 2023•182 countries
Series quick facts
High-level context for this country series.
Environment & EnergyWB WDI
Coverage
182
Frequency
yearly
Range
1961 \u2192 2023
Latest
2023
Cereal production (metric tons) by country
Latest available value per country (as of 2023)
Low \u2192 High
Unit: metric tons
≤ 8.98K
8.98K – 249.38K
249.38K – 1.08M
1.08M – 3.18M
3.18M – 5.25M
5.25M – 20.81M
> 20.81M
No data
Generated by MacroVedia.comSource: World Bank (WB WDI)
Highest 15 countries
Cereal production (metric tons)
50 countries with data
Generated by MacroVedia.comSource: World Bank (WB WDI)
Distribution across countries
Cereal production (metric tons)
Countries
50
Median
21.5M
Mean
58.9M
25th pctl
10.3M
75th pctl
53.2M
Generated by MacroVedia.comSource: World Bank (WB WDI)
Compare trends
Cereal production (metric tons)
ChinaUnited StatesIndia
Generated by MacroVedia.comSource: World Bank (WB WDI)
| Country | Latest | Date | Trend |
|---|---|---|---|
| ChinaCHN | 641.73M metric tons | 2023 | |
| United StatesUSA | 462.63M metric tons | 2023 | |
| IndiaIND | 374.6M metric tons | 2023 | |
| BrazilBRA | 155.88M metric tons | 2023 | |
| Russian FederationRUS | 136.71M metric tons | 2023 | |
| IndonesiaIDN | 73.97M metric tons | 2023 | |
| BangladeshBGD | 64.33M metric tons | 2023 | |
| FranceFRA | 64.24M metric tons | 2023 | |
| ArgentinaARG | 62.11M metric tons | 2023 | |
| UkraineUKR | 59.31M metric tons | 2023 | |
| CanadaCAN | 59.24M metric tons | 2023 | |
| AustraliaAUS | 59.04M metric tons | 2023 | |
| PakistanPAK | 53.19M metric tons | 2023 | |
| Viet NamVNM | 47.94M metric tons | 2023 | |
| GermanyDEU | 42.46M metric tons | 2023 | |
| TurkiyeTUR | 42.19M metric tons | 2023 | |
| ThailandTHA | 38.53M metric tons | 2023 | |
| MexicoMEX | 37.02M metric tons | 2023 | |
| PolandPOL | 35.18M metric tons | 2023 | |
| EthiopiaETH | 30.15M metric tons | 2023 | |
| PhilippinesPHL | 28.47M metric tons | 2023 | |
| MyanmarMMR | 28.29M metric tons | 2023 | |
| NigeriaNGA | 28.05M metric tons | 2023 | |
| Egypt, Arab Rep.EGY | 23.39M metric tons | 2023 | |
| United KingdomGBR | 22.05M metric tons | 2023 | |
| Iran, Islamic Rep.IRN | 20.96M metric tons | 2023 | |
| RomaniaROU | 20.78M metric tons | 2023 | |
| South AfricaZAF | 19.01M metric tons | 2023 | |
| KazakhstanKAZ | 17.08M metric tons | 2023 | |
| ItalyITA | 15.45M metric tons | 2023 | |
| HungaryHUN | 15.04M metric tons | 2023 | |
| CambodiaKHM | 14.38M metric tons | 2023 | |
| TanzaniaTZA | 12.79M metric tons | 2023 | |
| SpainESP | 11.93M metric tons | 2023 | |
| JapanJPN | 11.5M metric tons | 2023 | |
| NepalNPL | 11.15M metric tons | 2023 | |
| SerbiaSRB | 10.83M metric tons | 2023 | |
| BulgariaBGR | 10.35M metric tons | 2023 | |
| MaliMLI | 9.98M metric tons | 2023 | |
| CzechiaCZE | 8M metric tons | 2023 | |
| UzbekistanUZB | 7.91M metric tons | 2023 | |
| SudanSDN | 7.68M metric tons | 2022 | |
| BelarusBLR | 7.05M metric tons | 2023 | |
| DenmarkDNK | 7M metric tons | 2023 | |
| ParaguayPRY | 6.87M metric tons | 2023 | |
| GhanaGHA | 5.77M metric tons | 2023 | |
| MoroccoMAR | 5.67M metric tons | 2023 | |
| LithuaniaLTU | 5.63M metric tons | 2023 | |
| PeruPER | 5.5M metric tons | 2023 | |
| MadagascarMDG | 5.39M metric tons | 2023 |
Source: World Bank (WB WDI)