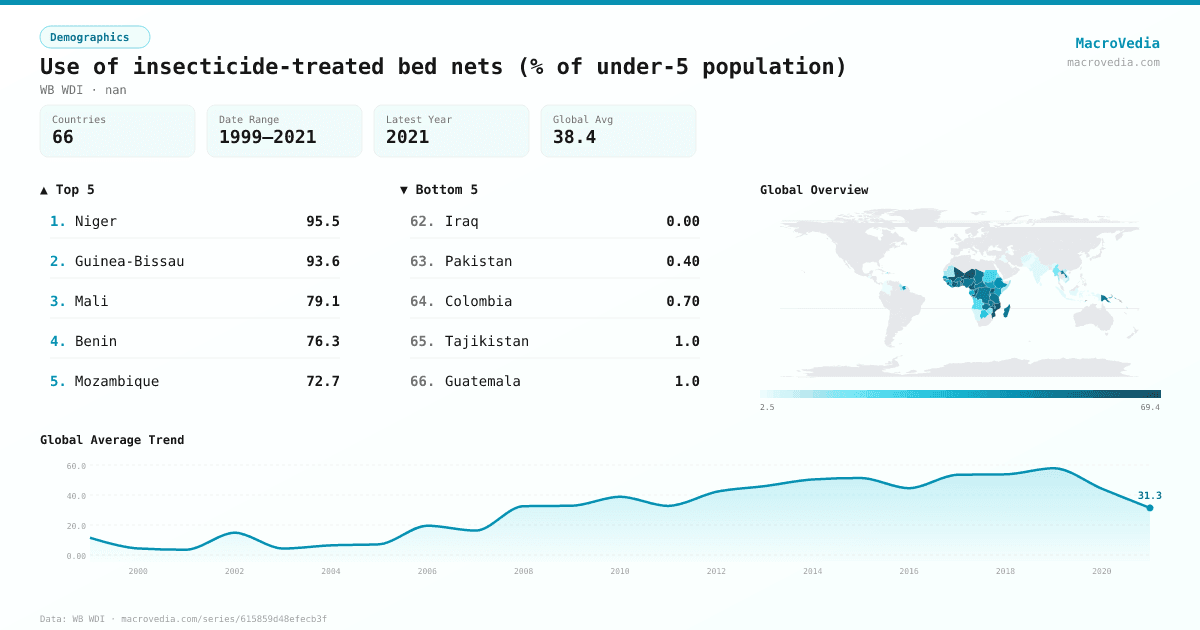
Use of insecticide-treated bed nets (% of under-5 population)
DemographicsWB WDIwb_wdi:SH.MLR.NETS.ZS•nan•1999 → 2021•66 countries
Series quick facts
High-level context for this country series.
DemographicsWB WDI
Coverage
66
Frequency
yearly
Range
1999 \u2192 2021
Latest
2021
Use of insecticide-treated bed nets (% of under-5 population) by country
Latest available value per country (as of 2021)
Low \u2192 High
Unit: %
≤ 4.26%
4.26% – 20.93%
20.93% – 40.93%
40.93% – 49.91%
49.91% – 54.49%
54.49% – 62%
> 62%
No data
Generated by MacroVedia.comSource: World Bank (WB WDI)
Highest 15 countries
Use of insecticide-treated bed nets (% of under-5 population)
50 countries with data
Generated by MacroVedia.comSource: World Bank (WB WDI)
Distribution across countries
Use of insecticide-treated bed nets (% of under-5 population)
Countries
50
Median
51.3%
Mean
50.7%
25th pctl
41.1%
75th pctl
59.8%
Generated by MacroVedia.comSource: World Bank (WB WDI)
Compare trends
Use of insecticide-treated bed nets (% of under-5 population)
SenegalMalawiZambia
Generated by MacroVedia.comSource: World Bank (WB WDI)
| Country | Latest | Date | Trend |
|---|---|---|---|
| NigerNER | 95.5% | 2015 | |
| Guinea-BissauGNB | 93.6% | 2019 | |
| MaliMLI | 79.1% | 2018 | |
| BeninBEN | 76.3% | 2018 | |
| MozambiqueMOZ | 72.7% | 2018 | |
| TogoTGO | 69.7% | 2017 | |
| Solomon IslandsSLB | 69.6% | 2015 | |
| KiribatiKIR | 69.2% | 2019 | — |
| MalawiMWI | 67.9% | 2020 | |
| Sao Tome and PrincipeSTP | 62.6% | 2019 | |
| Congo, Rep.COG | 60.5% | 2015 | |
| UgandaUGA | 60.3% | 2019 | |
| CameroonCMR | 59.8% | 2018 | |
| Cote d'IvoireCIV | 59.7% | 2016 | |
| Sierra LeoneSLE | 59.1% | 2019 | |
| Timor-LesteTLS | 55.7% | 2016 | |
| MadagascarMDG | 55.6% | 2021 | |
| RwandaRWA | 55.6% | 2020 | |
| TanzaniaTZA | 54.6% | 2017 | |
| Burkina FasoBFA | 54.4% | 2018 | |
| ChadTCD | 54.3% | 2019 | |
| GhanaGHA | 54.1% | 2019 | |
| NigeriaNGA | 52.2% | 2018 | |
| ZambiaZMB | 51.6% | 2019 | |
| Papua New GuineaPNG | 51.5% | 2018 | — |
| Congo, Dem. Rep.COD | 51% | 2018 | |
| VanuatuVUT | 51% | 2013 | |
| Central African RepublicCAF | 50.6% | 2019 | |
| Lao PDRLAO | 49.8% | 2017 | |
| EritreaERI | 48.9% | 2008 | |
| SenegalSEN | 46.5% | 2021 | |
| EthiopiaETH | 45.3% | 2015 | |
| LiberiaLBR | 44.3% | 2020 | |
| Gambia, TheGMB | 44% | 2020 | |
| SurinameSUR | 43.4% | 2010 | |
| KenyaKEN | 42% | 2020 | |
| South SudanSSD | 41.7% | 2017 | |
| ComorosCOM | 41.1% | 2012 | |
| BurundiBDI | 39.9% | 2017 | |
| GabonGAB | 38.8% | 2012 | |
| GuineaGIN | 38.2% | 2021 | |
| NamibiaNAM | 34% | 2009 | |
| MauritaniaMRT | 32.1% | 2015 | |
| BotswanaBWA | 30.9% | 2012 | — |
| SudanSDN | 25.3% | 2009 | |
| Equatorial GuineaGNQ | 23% | 2011 | |
| AngolaAGO | 21.7% | 2016 | |
| DjiboutiDJI | 19.9% | 2009 | |
| MyanmarMMR | 18.6% | 2016 | |
| HaitiHTI | 18.2% | 2017 |
Source: World Bank (WB WDI)