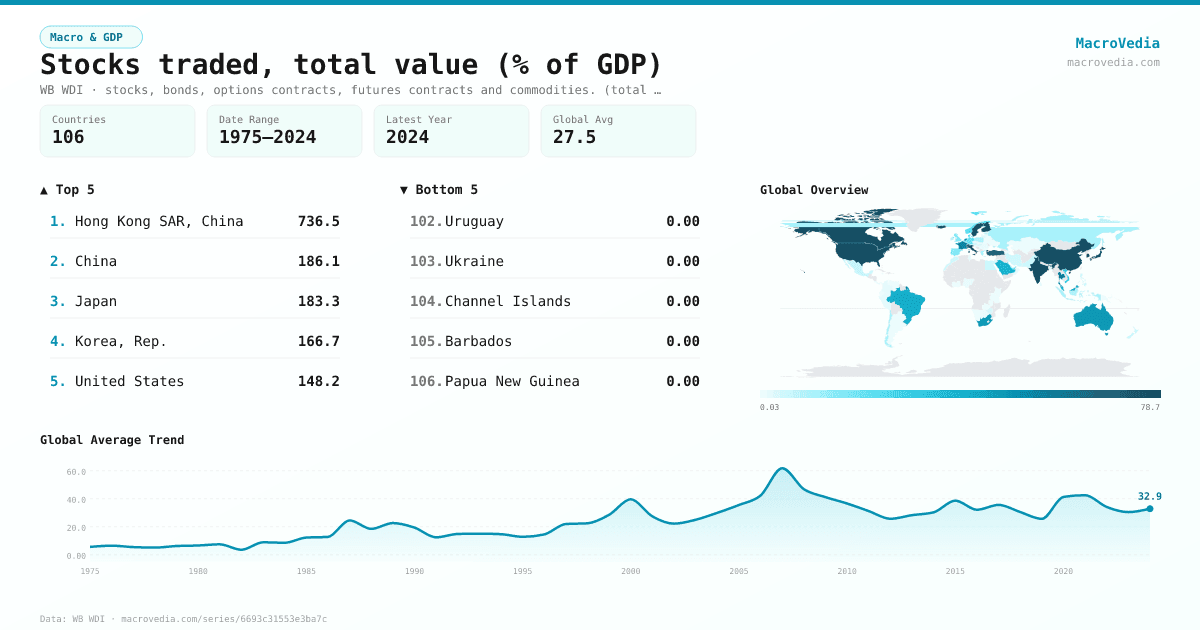
Stocks traded, total value (% of GDP)
Macro & GDPWB WDIwb_wdi:CM.MKT.TRAD.GD.ZS•stocks, bonds, options contracts, futures contracts and commodities. (total number of shares traded, both domestic and foreign, multiplied by respective prices)•1975 → 2024•106 countries
Series quick facts
High-level context for this country series.
Macro & GDPWB WDI
Coverage
106
Frequency
yearly
Range
1975 \u2192 2024
Latest
2024
Stocks traded, total value (% of GDP) by country
Latest available value per country (as of 2024)
Low \u2192 High
Unit: %
≤ 0.1%
0.1% – 0.53%
0.53% – 1.53%
1.53% – 5.22%
5.22% – 19.93%
19.93% – 57.34%
> 57.34%
No data
Generated by MacroVedia.comSource: World Bank (WB WDI)
Highest 15 countries
Stocks traded, total value (% of GDP)
50 countries with data
Generated by MacroVedia.comSource: World Bank (WB WDI)
Distribution across countries
Stocks traded, total value (% of GDP)
Countries
50
Median
31.3%
Mean
60.5%
25th pctl
8.9%
75th pctl
76.8%
Generated by MacroVedia.comSource: World Bank (WB WDI)
Compare trends
Stocks traded, total value (% of GDP)
JapanUnited StatesCanada
Generated by MacroVedia.comSource: World Bank (WB WDI)
| Country | Latest | Date | Trend |
|---|---|---|---|
| Hong Kong SAR, ChinaHKG | 736.5% | 2024 | |
| ChinaCHN | 186.05% | 2024 | |
| JapanJPN | 183.35% | 2024 | |
| Korea, Rep.KOR | 166.73% | 2024 | |
| United StatesUSA | 148.17% | 2024 | |
| Iran, Islamic Rep.IRN | 101.29% | 2023 | |
| CanadaCAN | 95.83% | 2024 | |
| FinlandFIN | 95.59% | 2004 | |
| ItalyITA | 94.59% | 2014 | |
| IndiaIND | 85.61% | 2024 | |
| IcelandISL | 84.04% | 2004 | |
| SwedenSWE | 80.56% | 2004 | |
| SwitzerlandCHE | 76.81% | 2024 | |
| TurkiyeTUR | 70.57% | 2024 | |
| SingaporeSGP | 58.21% | 2018 | |
| ThailandTHA | 57.34% | 2024 | |
| FranceFRA | 54.39% | 2015 | |
| NetherlandsNLD | 52.82% | 2014 | |
| AustraliaAUS | 48.11% | 2024 | |
| South AfricaZAF | 47.87% | 2024 | |
| BrazilBRA | 41.62% | 2024 | |
| MalaysiaMYS | 39.3% | 2024 | |
| Saudi ArabiaSAU | 38.24% | 2024 | |
| United KingdomGBR | 35.34% | 2022 | |
| Viet NamVNM | 33.67% | 2024 | |
| KuwaitKWT | 28.95% | 2024 | |
| DenmarkDNK | 27.06% | 2004 | |
| NorwayNOR | 24.88% | 2019 | |
| United Arab EmiratesARE | 21.82% | 2024 | |
| PortugalPRT | 20.34% | 2014 | |
| BelgiumBEL | 19.93% | 2014 | |
| GermanyDEU | 19.72% | 2024 | |
| IsraelISR | 18.54% | 2023 | |
| SpainESP | 16.01% | 2024 | |
| QatarQAT | 13.34% | 2024 | |
| GreeceGRC | 12.2% | 2024 | |
| Russian FederationRUS | 10.35% | 2023 | |
| ChileCHL | 8.87% | 2024 | |
| PolandPOL | 8.84% | 2024 | |
| IndonesiaIDN | 8.7% | 2024 | |
| IrelandIRL | 8.11% | 2018 | |
| EstoniaEST | 7.4% | 2004 | |
| MexicoMEX | 5.9% | 2024 | |
| AustriaAUT | 5.65% | 2024 | |
| PakistanPAK | 5.34% | 2024 | |
| Egypt, Arab Rep.EGY | 5.22% | 2024 | |
| New ZealandNZL | 4.84% | 2024 | |
| PhilippinesPHL | 4.73% | 2024 | |
| MoroccoMAR | 3.75% | 2024 | |
| HungaryHUN | 3.31% | 2024 |
Source: World Bank (WB WDI)