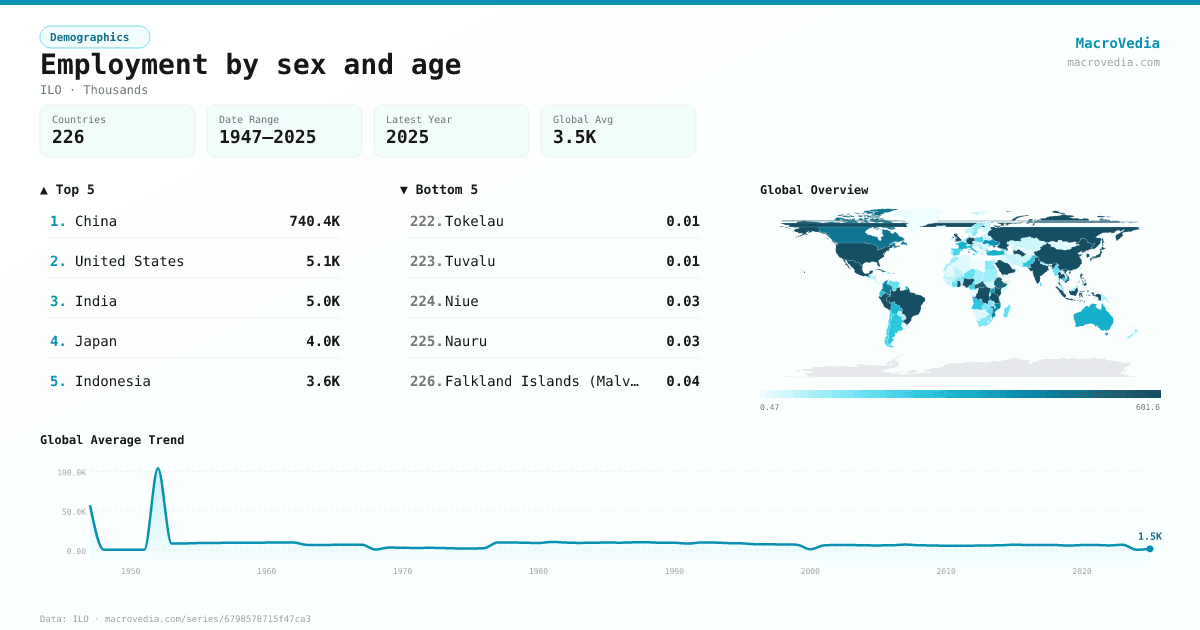
Employment by sex and age
DemographicsILOilostat:EMP_TEMP_SEX_AGE_NB_A•Thousands•1947 → 2025•218 countries
Series quick facts
High-level context for this country series.
DemographicsILO
Coverage
218
Frequency
yearly
Range
1947 \u2192 2025
Latest
2025
Employment by sex and age by country
Latest available value per country (as of 2025)
Low \u2192 High
Unit: Thousands
≤ 1.66K
1.66K – 9.28K
9.28K – 30.62K
30.62K – 67.2K
67.2K – 154.78K
154.78K – 460.88K
> 460.88K
No data
Generated by MacroVedia.comSource: International Labour Organization (ILO)
Highest 15 countries
Employment by sex and age
50 countries with data
Generated by MacroVedia.comSource: International Labour Organization (ILO)
Distribution across countries
Employment by sex and age
Countries
50
Median
680.6K
Mean
16M
25th pctl
314.4K
75th pctl
1.6M
Generated by MacroVedia.comSource: International Labour Organization (ILO)
Compare trends
Employment by sex and age
United StatesJapanKorea, Rep.
Generated by MacroVedia.comSource: International Labour Organization (ILO)
| Country | Latest | Date | Trend |
|---|---|---|---|
| ChinaCHN | 740.41M Thousands | 2023 | |
| UzbekistanUZB | 5.61M Thousands | 2019 | |
| United StatesUSA | 5.1M Thousands | 2025 | |
| IndiaIND | 4.98M Thousands | 2024 | |
| JapanJPN | 4.01M Thousands | 2025 | |
| IndonesiaIDN | 3.62M Thousands | 2023 | |
| Korea, Rep.KOR | 2.08M Thousands | 2025 | |
| Viet NamVNM | 1.93M Thousands | 2024 | |
| TurkmenistanTKM | 1.91M Thousands | 1999 | |
| AlgeriaDZA | 1.84M Thousands | 2016 | |
| CubaCUB | 1.84M Thousands | 2013 | |
| GhanaGHA | 1.69M Thousands | 2024 | |
| Papua New GuineaPNG | 1.57M Thousands | 2011 | |
| NigeriaNGA | 1.56M Thousands | 2024 | |
| Saudi ArabiaSAU | 1.35M Thousands | 2014 | |
| NicaraguaNIC | 1.35M Thousands | 2013 | |
| BrazilBRA | 1.27M Thousands | 2024 | |
| Puerto Rico (US)PRI | 1.17M Thousands | 2025 | |
| MexicoMEX | 1.17M Thousands | 2024 | |
| ThailandTHA | 1.12M Thousands | 2024 | |
| PhilippinesPHL | 1.1M Thousands | 2023 | |
| ChadTCD | 1.04M Thousands | 1993 | — |
| TanzaniaTZA | 957.26K Thousands | 2024 | |
| Russian FederationRUS | 861.19K Thousands | 2024 | |
| GermanyDEU | 720.52K Thousands | 2024 | |
| Congo, Dem. Rep.COD | 640.69K Thousands | 2020 | |
| United KingdomGBR | 627.88K Thousands | 2024 | |
| PeruPER | 612.59K Thousands | 2024 | |
| KenyaKEN | 590.62K Thousands | 2022 | |
| Central African RepublicCAF | 543.67K Thousands | 2003 | — |
| EthiopiaETH | 509.99K Thousands | 2021 | |
| CanadaCAN | 460.88K Thousands | 2025 | |
| ColombiaCOL | 434.65K Thousands | 2024 | |
| MozambiqueMOZ | 401.48K Thousands | 2022 | |
| UkraineUKR | 380.73K Thousands | 2021 | |
| UgandaUGA | 342.19K Thousands | 2021 | |
| TurkiyeTUR | 315.73K Thousands | 2024 | |
| AustraliaAUS | 314.4K Thousands | 2024 | |
| FranceFRA | 310.55K Thousands | 2024 | |
| BoliviaBOL | 284.5K Thousands | 2024 | |
| EcuadorECU | 274.77K Thousands | 2025 | |
| ItalyITA | 272.2K Thousands | 2024 | |
| AngolaAGO | 261.69K Thousands | 2023 | |
| LibyaLBY | 259.48K Thousands | 2001 | — |
| PakistanPAK | 250.98K Thousands | 2025 | |
| ArgentinaARG | 242K Thousands | 2024 | |
| CameroonCMR | 223.88K Thousands | 2021 | |
| CambodiaKHM | 221.75K Thousands | 2023 | |
| MalawiMWI | 209.63K Thousands | 2020 | |
| ChileCHL | 208.08K Thousands | 2025 |
Source: International Labour Organization (ILO)