Labor force with advanced education, male (% of male working-age population with advanced education)
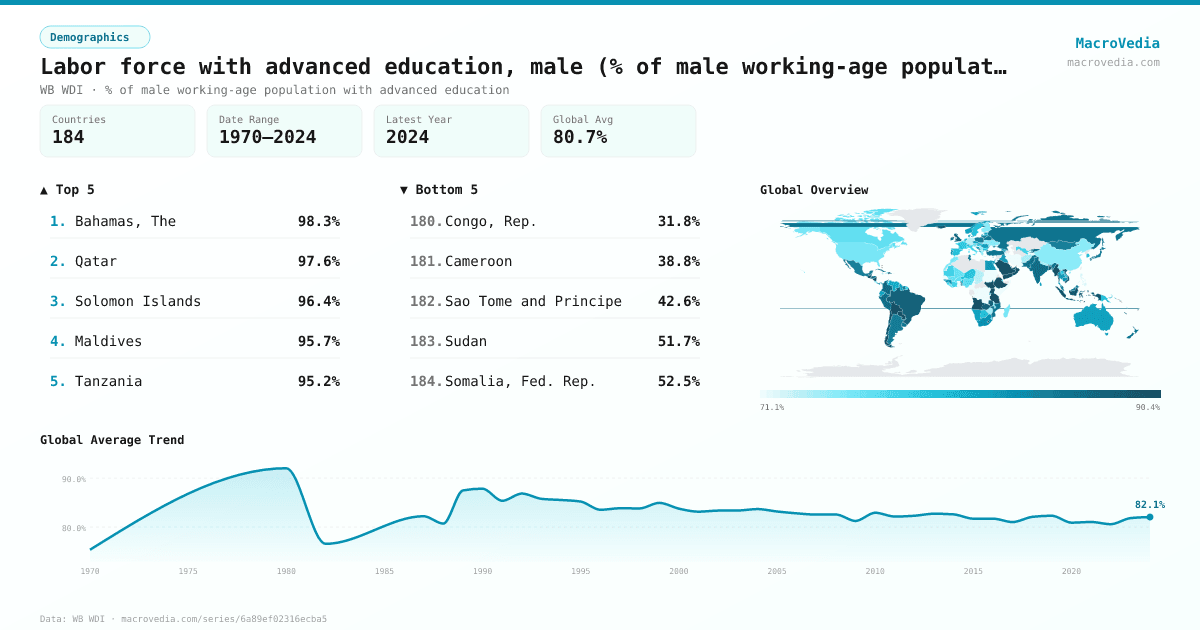
DemographicsWB WDIwb_wdi:SL.TLF.ADVN.MA.ZS•% of male working-age population with advanced education•1970 → 2024•184 countries
Series quick facts
High-level context for this country series.
DemographicsWB WDI
Coverage
184
Frequency
—
Range
1970 \u2192 2024
Latest
2024
Labor force with advanced education, male (% of male working-age population with advanced education) by country
Latest available value per country (as of 2024)
Low \u2192 High
Unit: %
≤ 73.98%
73.98% – 77.73%
77.73% – 80.37%
80.37% – 83.2%
83.2% – 86.07%
86.07% – 89.05%
> 89.05%
No data
Generated by MacroVedia.comSource: World Bank (WB WDI)
Highest 15 countries
Labor force with advanced education, male (% of male working-age population with advanced education)
50 countries with data
Generated by MacroVedia.comSource: World Bank (WB WDI)
Distribution across countries
Labor force with advanced education, male (% of male working-age population with advanced education)
Countries
50
Median
89.3%
Mean
90.3%
25th pctl
88%
75th pctl
92%
Generated by MacroVedia.comSource: World Bank (WB WDI)
Compare trends
Labor force with advanced education, male (% of male working-age population with advanced education)
IndonesiaUnited KingdomIreland
Generated by MacroVedia.comSource: World Bank (WB WDI)
| Country | Latest | Date | Trend |
|---|---|---|---|
| Bahamas, TheBHS | 98.32% | 2023 | |
| QatarQAT | 97.64% | 2021 | |
| Solomon IslandsSLB | 96.43% | 2013 | — |
| MaldivesMDV | 95.68% | 2019 | |
| TanzaniaTZA | 95.21% | 2024 | |
| United Arab EmiratesARE | 94.79% | 2023 | |
| EthiopiaETH | 94.65% | 2021 | |
| AngolaAGO | 93.44% | 2021 | |
| Macao SAR, ChinaMAC | 93.36% | 2016 | |
| South SudanSSD | 93.34% | 2008 | — |
| Saudi ArabiaSAU | 93.29% | 2024 | |
| ParaguayPRY | 92.36% | 2017 | |
| BoliviaBOL | 91.95% | 2024 | |
| OmanOMN | 91.94% | 2021 | |
| UgandaUGA | 91.58% | 2021 | |
| Antigua and BarbudaATG | 91.18% | 2018 | — |
| NicaraguaNIC | 91.09% | 2014 | |
| Yemen, Rep.YEM | 90.75% | 2014 | |
| MaltaMLT | 90.48% | 2024 | |
| MyanmarMMR | 90.35% | 2020 | |
| BelizeBLZ | 90.1% | 2019 | |
| GuatemalaGTM | 89.97% | 2024 | |
| ChileCHL | 89.94% | 2024 | |
| LesothoLSO | 89.61% | 2024 | |
| SeychellesSYC | 89.36% | 2024 | |
| IcelandISL | 89.15% | 2024 | |
| IndonesiaIDN | 89.1% | 2023 | |
| BangladeshBGD | 88.71% | 2024 | |
| Cayman IslandsCYM | 88.71% | 2015 | |
| MontenegroMNE | 88.65% | 2023 | |
| NauruNRU | 88.6% | 2021 | |
| New CaledoniaNCL | 88.53% | 2023 | |
| ZambiaZMB | 88.46% | 2023 | |
| Viet NamVNM | 88.39% | 2024 | |
| Dominican RepublicDOM | 88.36% | 2024 | |
| KuwaitKWT | 88.26% | 2016 | — |
| El SalvadorSLV | 88.2% | 2024 | |
| BrazilBRA | 88.03% | 2024 | |
| United KingdomGBR | 87.79% | 2024 | |
| KiribatiKIR | 87.56% | 2023 | |
| HondurasHND | 87.32% | 2024 | |
| SingaporeSGP | 87.32% | 2024 | |
| FijiFJI | 87.09% | 2024 | |
| West Bank and GazaPSE | 87.05% | 2024 | |
| Kyrgyz RepublicKGZ | 87.01% | 2018 | |
| ColombiaCOL | 87% | 2024 | |
| PeruPER | 86.84% | 2024 | |
| IndiaIND | 86.83% | 2024 | |
| PakistanPAK | 86.73% | 2021 | |
| IrelandIRL | 86.32% | 2024 |
Source: World Bank (WB WDI)