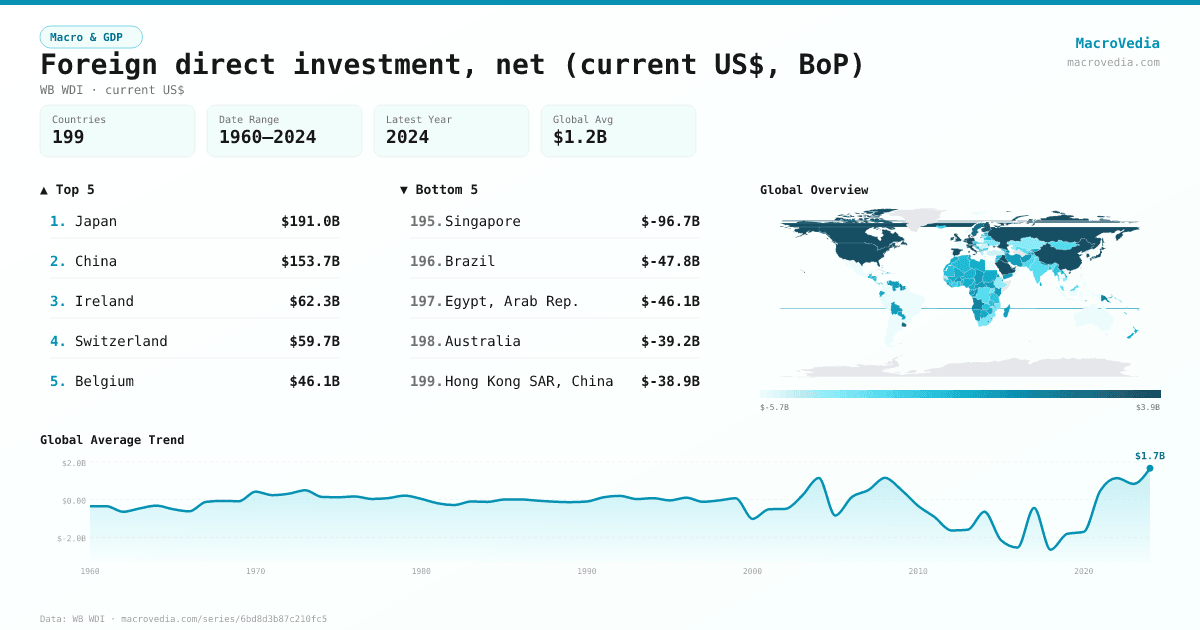
Foreign direct investment, net (current US$, BoP)
Macro & GDPWB WDIwb_wdi:BN.KLT.DINV.CD•current US$•1960 → 2024•199 countries
Series quick facts
High-level context for this country series.
Macro & GDPWB WDI
Coverage
199
Frequency
yearly
Range
1960 \u2192 2024
Latest
2024
Foreign direct investment, net (current US$, BoP) by country
Latest available value per country (as of 2024)
Low \u2192 High
Unit: US$
≤ -5.08B
-5.08B – -1.77B
-1.77B – -677.18M
-677.18M – -239.77M
-239.77M – -27.97M
-27.97M – 1.07B
> 1.07B
No data
Generated by MacroVedia.comSource: World Bank (WB WDI)
Highest 15 countries
Foreign direct investment, net (current US$, BoP)
50 countries with data
Generated by MacroVedia.comSource: World Bank (WB WDI)
Distribution across countries
Foreign direct investment, net (current US$, BoP)
Countries
50
Median
$2.37B
Mean
$19.46B
25th pctl
$24.26M
75th pctl
$25.11B
Generated by MacroVedia.comSource: World Bank (WB WDI)
Compare trends
Foreign direct investment, net (current US$, BoP)
CanadaNetherlandsUnited Kingdom
Generated by MacroVedia.comSource: World Bank (WB WDI)
| Country | Latest | Date | Trend |
|---|---|---|---|
| JapanJPN | $191.05B | 2024 | |
| ChinaCHN | $153.69B | 2024 | |
| SwitzerlandCHE | $106.46B | 2023 | |
| IrelandIRL | $62.33B | 2024 | |
| CanadaCAN | $46.7B | 2023 | |
| BelgiumBEL | $46.07B | 2024 | |
| United KingdomGBR | $42.8B | 2024 | |
| LuxembourgLUX | $39.53B | 2023 | |
| Korea, Rep.KOR | $33.36B | 2024 | |
| GermanyDEU | $32.56B | 2024 | |
| United Arab EmiratesARE | $31.53B | 2024 | |
| SpainESP | $28.71B | 2024 | |
| United StatesUSA | $25.11B | 2024 | |
| SwedenSWE | $21.67B | 2023 | |
| Russian FederationRUS | $20.75B | 2023 | |
| ItalyITA | $18.97B | 2024 | |
| DenmarkDNK | $11.89B | 2024 | |
| NetherlandsNLD | $11.13B | 2024 | |
| KuwaitKWT | $9.71B | 2024 | |
| IraqIRQ | $8.09B | 2024 | |
| Saudi ArabiaSAU | $6.27B | 2024 | |
| AustriaAUT | $5.45B | 2023 | |
| FinlandFIN | $3.28B | 2024 | |
| GuyanaGUY | $3B | 2022 | |
| UruguayURY | $2.58B | 2024 | |
| AngolaAGO | $2.15B | 2023 | |
| Trinidad and TobagoTTO | $2.03B | 2023 | |
| AzerbaijanAZE | $1.62B | 2023 | |
| QatarQAT | $1.1B | 2024 | |
| Congo, Rep.COG | $1B | 2020 | |
| Papua New GuineaPNG | $967.88M | 2024 | |
| MauritiusMUS | $962.72M | 2024 | |
| Yemen, Rep.YEM | $233.1M | 2014 | |
| ArubaABW | $192.34M | 2023 | |
| SurinameSUR | $63.48M | 2023 | |
| San MarinoSMR | $52.72M | 2023 | |
| LesothoLSO | $25.65M | 2023 | |
| AfghanistanAFG | $24.26M | 2020 | |
| Sao Tome and PrincipeSTP | $20.51M | 2024 | |
| Solomon IslandsSLB | $19.91M | 2024 | |
| Central African RepublicCAF | $15.3M | 1993 | |
| TongaTON | $13.33M | 2024 | |
| NauruNRU | $4.51M | 2024 | |
| South SudanSSD | $2.21M | 2019 | |
| TuvaluTUV | -$915.23K | 2021 | |
| SamoaWSM | -$1.69M | 2024 | |
| NamibiaNAM | -$1.93M | 2024 | |
| Marshall IslandsMHL | -$3.05M | 2020 | |
| ComorosCOM | -$5.35M | 2023 | |
| KiribatiKIR | -$8.06M | 2024 |
Source: World Bank (WB WDI)