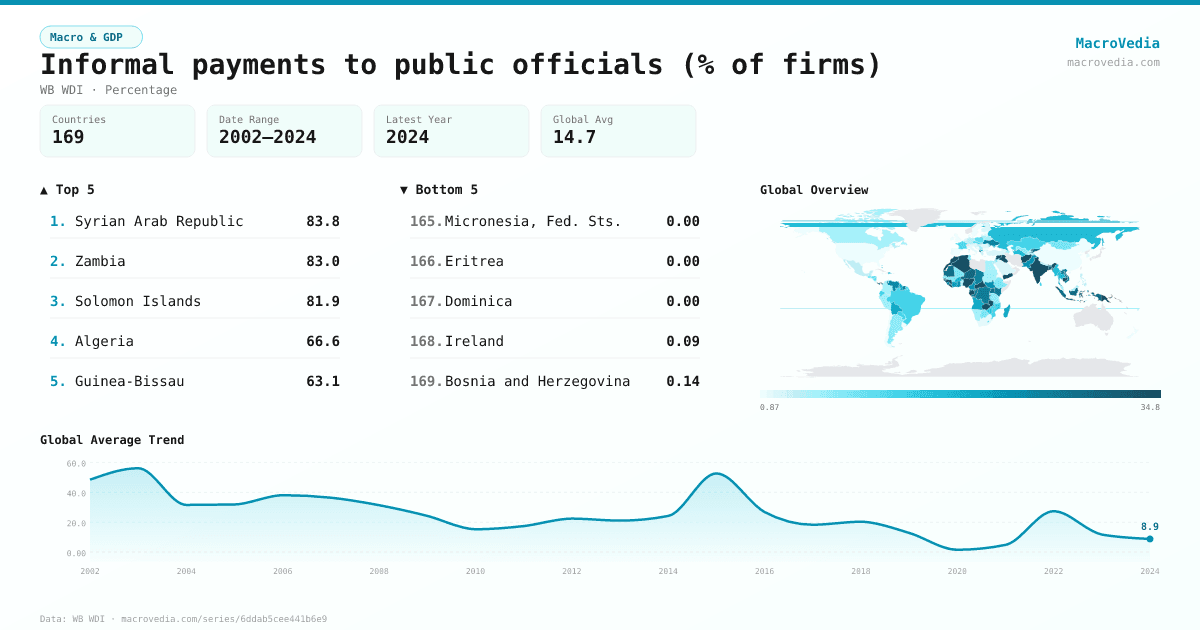
Informal payments to public officials (% of firms)
Macro & GDPWB WDIwb_wdi:IC.FRM.CORR.ZS•Percentage•2002 → 2024•169 countries
Series quick facts
High-level context for this country series.
Macro & GDPWB WDI
Coverage
169
Frequency
—
Range
2002 \u2192 2024
Latest
2024
Informal payments to public officials (% of firms) by country
Latest available value per country (as of 2024)
Low \u2192 High
Unit: %
≤ 2.69%
2.69% – 6.71%
6.71% – 11.57%
11.57% – 16.45%
16.45% – 24.81%
24.81% – 45.63%
> 45.63%
No data
Generated by MacroVedia.comSource: World Bank (WB WDI)
Highest 15 countries
Informal payments to public officials (% of firms)
50 countries with data
Generated by MacroVedia.comSource: World Bank (WB WDI)
Distribution across countries
Informal payments to public officials (% of firms)
Countries
50
Median
44.7%
Mean
48.8%
25th pctl
30.5%
75th pctl
59.4%
Generated by MacroVedia.comSource: World Bank (WB WDI)
Compare trends
Informal payments to public officials (% of firms)
Kyrgyz RepublicLao PDRSlovak Republic
Generated by MacroVedia.comSource: World Bank (WB WDI)
| Country | Latest | Date | Trend |
|---|---|---|---|
| Viet NamVNM | 90.7% | 2015 | |
| Papua New GuineaPNG | 89.32% | 2015 | — |
| Timor-LesteTLS | 85.64% | 2015 | |
| GuineaGIN | 84.75% | 2006 | — |
| Syrian Arab RepublicSYR | 83.8% | 2009 | — |
| ZambiaZMB | 82.97% | 2019 | |
| MauritaniaMRT | 82.12% | 2006 | — |
| UkraineUKR | 82.04% | 2013 | |
| Solomon IslandsSLB | 81.91% | 2015 | — |
| Congo, Rep.COG | 81.77% | 2009 | — |
| AlgeriaDZA | 66.6% | 2007 | — |
| Guinea-BissauGNB | 63.06% | 2006 | — |
| PhilippinesPHL | 59.35% | 2015 | |
| BurundiBDI | 56.46% | 2006 | — |
| NigeriaNGA | 55.31% | 2014 | |
| Yemen, Rep.YEM | 55.03% | 2013 | |
| LiberiaLBR | 52.77% | 2017 | |
| UgandaUGA | 51.7% | 2006 | — |
| IraqIRQ | 50.96% | 2022 | |
| Congo, Dem. Rep.COD | 50.39% | 2013 | |
| AngolaAGO | 48.92% | 2010 | |
| CambodiaKHM | 46.29% | 2023 | |
| Sierra LeoneSLE | 46.02% | 2017 | |
| PakistanPAK | 45.8% | 2013 | |
| CameroonCMR | 45.63% | 2016 | |
| MaliMLI | 43.85% | 2016 | |
| MadagascarMDG | 43.15% | 2013 | |
| Gambia, TheGMB | 42.32% | 2023 | |
| GabonGAB | 41.76% | 2009 | — |
| IndiaIND | 39.33% | 2022 | |
| AfghanistanAFG | 39.27% | 2014 | |
| Central African RepublicCAF | 34.93% | 2023 | |
| MoroccoMAR | 34.74% | 2023 | |
| BeninBEN | 33.44% | 2016 | |
| Equatorial GuineaGNQ | 32.82% | 2024 | — |
| AlbaniaALB | 31.58% | 2019 | |
| BangladeshBGD | 30.68% | 2022 | |
| PanamaPAN | 30.52% | 2010 | |
| IndonesiaIDN | 29.5% | 2023 | |
| NigerNER | 29.36% | 2017 | |
| SamoaWSM | 29.31% | 2009 | — |
| Kyrgyz RepublicKGZ | 28.29% | 2023 | |
| VanuatuVUT | 27.41% | 2023 | |
| Lao PDRLAO | 26.44% | 2024 | |
| KenyaKEN | 26.29% | 2018 | |
| MongoliaMNG | 26.03% | 2013 | |
| Slovak RepublicSVK | 25.34% | 2019 | |
| ChadTCD | 24.81% | 2023 | |
| SurinameSUR | 24.81% | 2018 | |
| Venezuela, RBVEN | 23.65% | 2010 | — |
Source: World Bank (WB WDI)