People using safely managed drinking water services, urban (% of urban population)
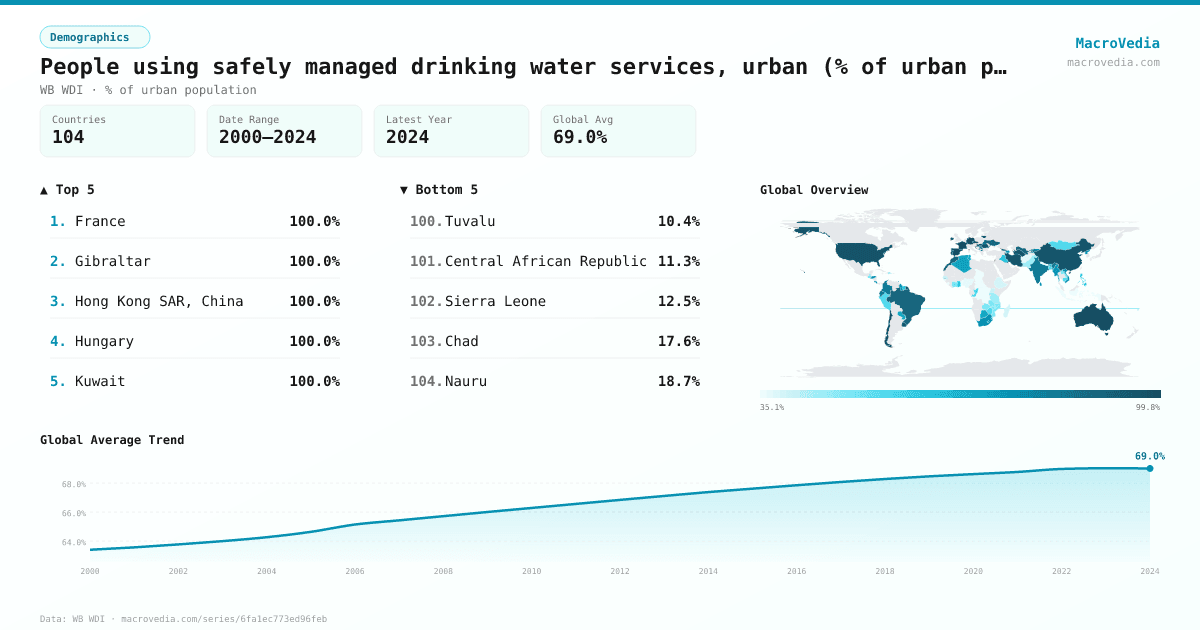
DemographicsWB WDIwb_wdi:SH.H2O.SMDW.UR.ZS•% of urban population•2000 → 2024•104 countries
Series quick facts
High-level context for this country series.
DemographicsWB WDI
Coverage
104
Frequency
yearly
Range
2000 \u2192 2024
Latest
2024
People using safely managed drinking water services, urban (% of urban population) by country
Latest available value per country (as of 2024)
Low \u2192 High
Unit: %
≤ 38.35%
38.35% – 52.01%
52.01% – 67.97%
67.97% – 78.23%
78.23% – 91%
91% – 99.27%
> 99.27%
No data
Generated by MacroVedia.comSource: World Bank (WB WDI)
Highest 15 countries
People using safely managed drinking water services, urban (% of urban population)
50 countries with data
Generated by MacroVedia.comSource: World Bank (WB WDI)
Distribution across countries
People using safely managed drinking water services, urban (% of urban population)
Countries
50
Median
96.2%
Mean
91.6%
25th pctl
82.4%
75th pctl
99.6%
Generated by MacroVedia.comSource: World Bank (WB WDI)
Compare trends
People using safely managed drinking water services, urban (% of urban population)
FranceGibraltarHong Kong SAR, China
Generated by MacroVedia.comSource: World Bank (WB WDI)
| Country | Latest | Date | Trend |
|---|---|---|---|
| FranceFRA | 100% | 2024 | |
| GibraltarGIB | 100% | 2024 | |
| Hong Kong SAR, ChinaHKG | 100% | 2024 | |
| HungaryHUN | 100% | 2024 | |
| KuwaitKWT | 100% | 2024 | |
| Macao SAR, ChinaMAC | 100% | 2024 | |
| MonacoMCO | 100% | 2024 | |
| SingaporeSGP | 100% | 2024 | |
| San MarinoSMR | 100% | 2024 | |
| GermanyDEU | 100% | 2024 | |
| LuxembourgLUX | 99.8% | 2024 | |
| SpainESP | 99.65% | 2024 | |
| AustraliaAUS | 99.65% | 2024 | |
| IsraelISR | 99.47% | 2024 | |
| LithuaniaLTU | 99.32% | 2024 | |
| ChileCHL | 99.24% | 2024 | |
| CzechiaCZE | 98.02% | 2024 | |
| PalauPLW | 97.7% | 2024 | |
| United StatesUSA | 97.68% | 2024 | |
| PortugalPRT | 96.96% | 2024 | |
| TurkmenistanTKM | 96.94% | 2024 | |
| St. Martin (French part)MAF | 96.63% | 2024 | |
| CroatiaHRV | 96.48% | 2024 | |
| ChinaCHN | 96.43% | 2024 | |
| Iran, Islamic Rep.IRN | 96.23% | 2024 | |
| IrelandIRL | 96.12% | 2024 | |
| RomaniaROU | 94.95% | 2024 | |
| UruguayURY | 94.59% | 2024 | |
| SamoaWSM | 91.96% | 2024 | |
| MoroccoMAR | 91.25% | 2024 | |
| BrazilBRA | 90.66% | 2024 | |
| GeorgiaGEO | 89.31% | 2024 | |
| UzbekistanUZB | 88.92% | 2024 | |
| UkraineUKR | 88.28% | 2024 | |
| MontenegroMNE | 87.32% | 2024 | |
| North MacedoniaMKD | 84.73% | 2024 | |
| IndiaIND | 82.97% | 2024 | |
| EcuadorECU | 82.35% | 2024 | |
| West Bank and GazaPSE | 81.86% | 2024 | |
| ColombiaCOL | 81.81% | 2024 | |
| SerbiaSRB | 81.6% | 2024 | |
| Kyrgyz RepublicKGZ | 81.01% | 2024 | |
| Costa RicaCRI | 80.39% | 2024 | |
| Sri LankaLKA | 80.11% | 2024 | |
| HondurasHND | 78.44% | 2024 | |
| Korea, Dem. People's Rep.PRK | 76.96% | 2023 | |
| EswatiniSWZ | 76.88% | 2024 | |
| AzerbaijanAZE | 76.53% | 2024 | |
| GuyanaGUY | 76.04% | 2024 | |
| Viet NamVNM | 75.82% | 2024 |
Source: World Bank (WB WDI)