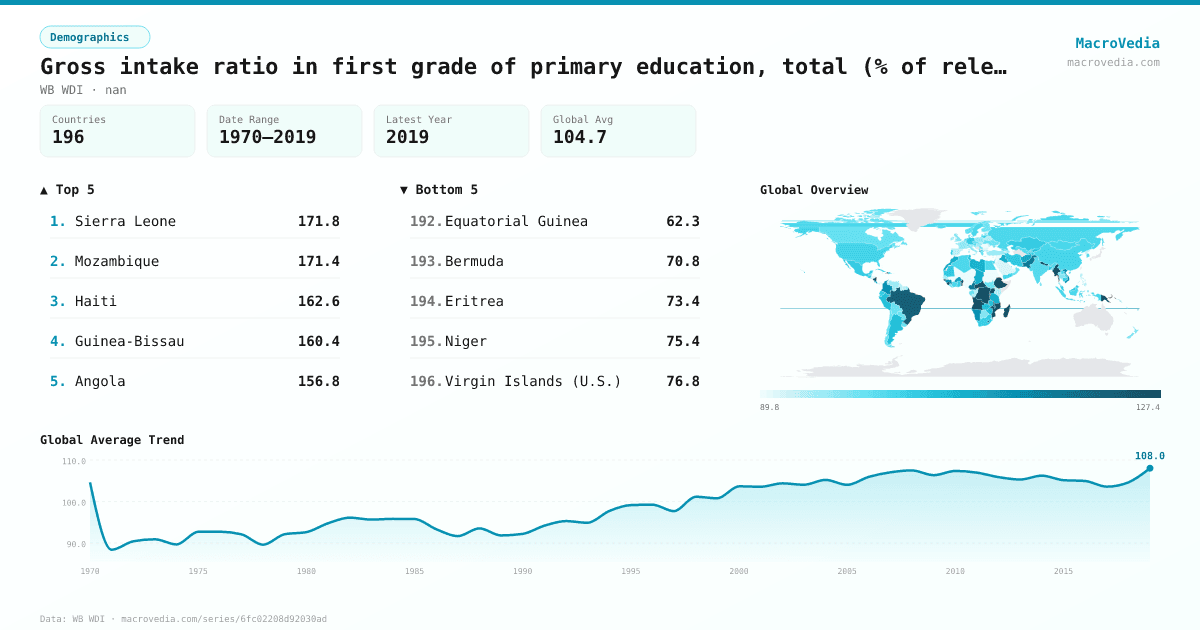
Gross intake ratio in first grade of primary education, total (% of relevant age group)
DemographicsWB WDIwb_wdi:SE.PRM.GINT.ZS•nan•1970 → 2019•196 countries
Series quick facts
High-level context for this country series.
DemographicsWB WDI
Coverage
196
Frequency
yearly
Range
1970 \u2192 2019
Latest
2019
Gross intake ratio in first grade of primary education, total (% of relevant age group) by country
Latest available value per country (as of 2019)
Low \u2192 High
Unit: %
≤ 92.76%
92.76% – 97.59%
97.59% – 100.29%
100.29% – 102.85%
102.85% – 105.83%
105.83% – 114.98%
> 114.98%
No data
Generated by MacroVedia.comSource: World Bank (WB WDI)
Highest 15 countries
Gross intake ratio in first grade of primary education, total (% of relevant age group)
50 countries with data
Generated by MacroVedia.comSource: World Bank (WB WDI)
Distribution across countries
Gross intake ratio in first grade of primary education, total (% of relevant age group)
Countries
50
Median
117%
Mean
126.2%
25th pctl
111%
75th pctl
139.9%
Generated by MacroVedia.comSource: World Bank (WB WDI)
Compare trends
Gross intake ratio in first grade of primary education, total (% of relevant age group)
MoroccoLesothoCosta Rica
Generated by MacroVedia.comSource: World Bank (WB WDI)
| Country | Latest | Date | Trend |
|---|---|---|---|
| Sierra LeoneSLE | 171.85% | 2018 | |
| MozambiqueMOZ | 171.36% | 2018 | |
| HaitiHTI | 162.61% | 1997 | |
| Guinea-BissauGNB | 160.41% | 2010 | |
| AngolaAGO | 156.77% | 2011 | |
| MadagascarMDG | 155.53% | 2018 | |
| British Virgin IslandsVGB | 150.16% | 2017 | |
| BeninBEN | 146.92% | 2018 | |
| NepalNPL | 146.62% | 2019 | |
| NicaraguaNIC | 143.06% | 2010 | |
| TogoTGO | 141.66% | 2018 | |
| EthiopiaETH | 141.52% | 2015 | |
| Congo, Dem. Rep.COD | 139.92% | 2015 | |
| UgandaUGA | 139.42% | 2017 | |
| NauruNRU | 137.31% | 2016 | |
| MyanmarMMR | 135.29% | 2017 | |
| MalawiMWI | 130.57% | 2018 | |
| Central African RepublicCAF | 128.09% | 2016 | |
| BurundiBDI | 128.06% | 2018 | |
| Papua New GuineaPNG | 127.75% | 2016 | |
| RwandaRWA | 127.06% | 2018 | |
| BrazilBRA | 123.59% | 2005 | |
| Sint Maarten (Dutch part)SXM | 122.06% | 2014 | |
| LesothoLSO | 119.7% | 2017 | |
| PakistanPAK | 117.24% | 2018 | |
| CameroonCMR | 116.77% | 2018 | |
| Viet NamVNM | 115.27% | 2018 | |
| GuineaGIN | 115% | 2016 | |
| SamoaWSM | 114.98% | 2018 | |
| DominicaDMA | 113.98% | 2016 | |
| Hong Kong SAR, ChinaHKG | 113.61% | 2018 | |
| ColombiaCOL | 113.55% | 2018 | |
| St. Vincent and the GrenadinesVCT | 113.39% | 2018 | |
| NamibiaNAM | 113.31% | 2018 | |
| TongaTON | 111.94% | 2013 | |
| FijiFJI | 111.47% | 2016 | |
| Burkina FasoBFA | 111.1% | 2018 | |
| ArubaABW | 110.99% | 2014 | |
| French PolynesiaPYF | 110.9% | 1983 | — |
| AfghanistanAFG | 110.78% | 2018 | |
| Costa RicaCRI | 110.77% | 2018 | |
| IraqIRQ | 110.16% | 2007 | |
| MoroccoMAR | 109.84% | 2018 | |
| TanzaniaTZA | 109.15% | 2018 | |
| AlbaniaALB | 109.09% | 2018 | |
| ChadTCD | 109.08% | 2016 | |
| LibyaLBY | 108.45% | 1983 | |
| Solomon IslandsSLB | 108% | 2018 | |
| ZimbabweZWE | 107.52% | 2013 | |
| ZambiaZMB | 107.42% | 2017 |
Source: World Bank (WB WDI)