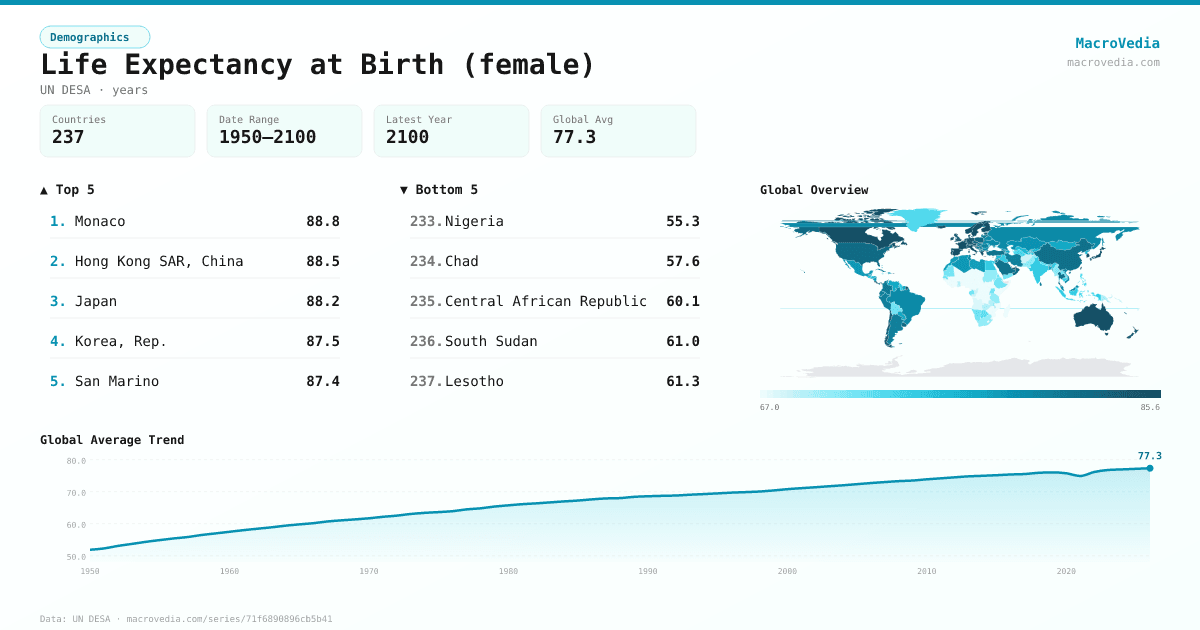
Life Expectancy at Birth (female)
DemographicsUN DESAun_desa_pop:LExFemale•years•1950 → 2026•225 countries
Series quick facts
High-level context for this country series.
DemographicsUN DESA
Coverage
225
Frequency
yearly
Range
1950 \u2192 2026
Latest
2026
Life Expectancy at Birth (female) by country
Latest available value per country (as of 2026)
Low \u2192 High
Unit: years
≤ 68.83
68.83 – 73.23
73.23 – 77.11
77.11 – 79.95
79.95 – 81.89
81.89 – 84.69
> 84.69
No data
Generated by MacroVedia.comSource: UN Department of Economic and Social Affairs (UN DESA)
Highest 15 countries
Life Expectancy at Birth (female)
50 countries with data
Generated by MacroVedia.comSource: UN Department of Economic and Social Affairs (UN DESA)
Distribution across countries
Life Expectancy at Birth (female)
Countries
50
Median
85.3
Mean
85.4
25th pctl
84.2
75th pctl
86.2
Generated by MacroVedia.comSource: UN Department of Economic and Social Affairs (UN DESA)
Compare trends
Life Expectancy at Birth (female)
MonacoHong Kong SAR, ChinaJapan
Generated by MacroVedia.comSource: UN Department of Economic and Social Affairs (UN DESA)
| Country | Latest | Date | Trend |
|---|---|---|---|
| MonacoMCO | 88.85 years | 2026 | |
| Hong Kong SAR, ChinaHKG | 88.51 years | 2026 | |
| JapanJPN | 88.18 years | 2026 | |
| Korea, Rep.KOR | 87.51 years | 2026 | |
| San MarinoSMR | 87.44 years | 2026 | |
| French PolynesiaPYF | 86.86 years | 2026 | |
| SpainESP | 86.71 years | 2026 | |
| RéunionREU | 86.68 years | 2026 | |
| SingaporeSGP | 86.6 years | 2026 | |
| AndorraAND | 86.49 years | 2026 | |
| GibraltarGIB | 86.45 years | 2026 | |
| FranceFRA | 86.42 years | 2026 | |
| SwitzerlandCHE | 86.2 years | 2026 | |
| BermudaBMU | 86.14 years | 2026 | |
| ItalyITA | 86.13 years | 2026 | |
| AustraliaAUS | 86.07 years | 2026 | |
| MartiniqueMTQ | 85.95 years | 2026 | |
| GuadeloupeGLP | 85.88 years | 2026 | |
| GuernseyGGY | 85.88 years | 2026 | |
| Macao SAR, ChinaMAC | 85.64 years | 2026 | |
| LiechtensteinLIE | 85.64 years | 2026 | |
| Puerto Rico (US)PRI | 85.63 years | 2026 | |
| MaltaMLT | 85.63 years | 2026 | |
| PortugalPRT | 85.51 years | 2026 | |
| SwedenSWE | 85.45 years | 2026 | |
| NorwayNOR | 85.21 years | 2026 | |
| CanadaCAN | 85.16 years | 2026 | |
| FinlandFIN | 85.02 years | 2026 | |
| IsraelISR | 84.94 years | 2026 | |
| IrelandIRL | 84.86 years | 2026 | |
| GreeceGRC | 84.73 years | 2026 | |
| AustriaAUT | 84.69 years | 2026 | |
| BelgiumBEL | 84.69 years | 2026 | |
| SloveniaSVN | 84.69 years | 2026 | |
| IcelandISL | 84.69 years | 2026 | |
| United Arab EmiratesARE | 84.55 years | 2026 | |
| St. Martin (French part)MAF | 84.21 years | 2026 | |
| DenmarkDNK | 84.19 years | 2026 | |
| LuxembourgLUX | 84.17 years | 2026 | |
| GermanyDEU | 84.11 years | 2026 | |
| NetherlandsNLD | 84.1 years | 2026 | |
| New ZealandNZL | 84.1 years | 2026 | |
| CyprusCYP | 84.05 years | 2026 | |
| Costa RicaCRI | 83.87 years | 2026 | |
| QatarQAT | 83.72 years | 2026 | |
| United KingdomGBR | 83.57 years | 2026 | |
| ChileCHL | 83.51 years | 2026 | |
| EstoniaEST | 83.42 years | 2026 | |
| Isle of ManIMN | 83.4 years | 2026 | |
| MaldivesMDV | 83.34 years | 2026 |
Source: UN Department of Economic and Social Affairs (UN DESA)