Proportion of population further impoverished due to out-of-pocket health expenditure, based on the societal poverty …
DemographicsWB WDIwb_wdi:SH_UHC_FH40_FURTHER•Percentage•1985 → 2023•155 countries
Series quick facts
High-level context for this country series.
DemographicsWB WDI
Coverage
155
Frequency
—
Range
1985 \u2192 2023
Latest
2023
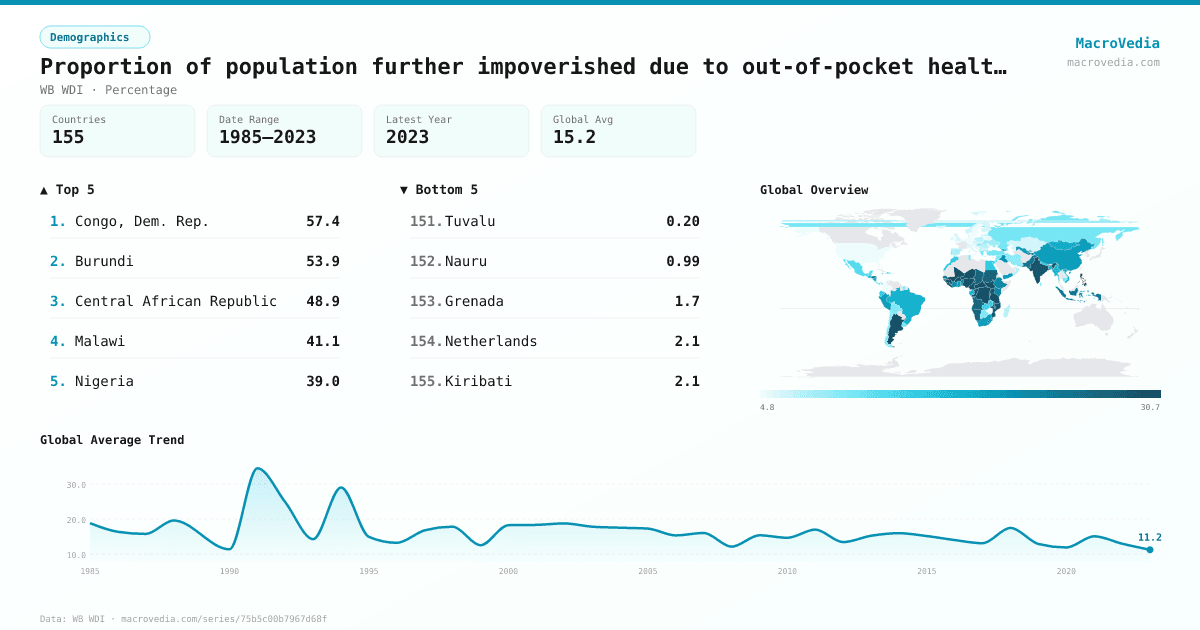
Proportion of population further impoverished due to out-of-pocket health expenditure, based on the societal poverty line (%) by country
Latest available value per country (as of 2023)
Low \u2192 High
Unit: %
≤ 5.66%
5.66% – 7.24%
7.24% – 9.99%
9.99% – 15.44%
15.44% – 20.33%
20.33% – 28.73%
> 28.73%
No data
Generated by MacroVedia.comSource: World Bank (WB WDI)
Highest 15 countries
Proportion of population further impoverished due to out-of-pocket health expenditure, based on the societal poverty line (%)
50 countries with data
Generated by MacroVedia.comSource: World Bank (WB WDI)
Distribution across countries
Proportion of population further impoverished due to out-of-pocket health expenditure, based on the societal poverty line (%)
Countries
50
Median
27.9%
Mean
29.7%
25th pctl
23.2%
75th pctl
32%
Generated by MacroVedia.comSource: World Bank (WB WDI)
Compare trends
Proportion of population further impoverished due to out-of-pocket health expenditure, based on the societal poverty line (%)
IndonesiaPeruMali
Generated by MacroVedia.comSource: World Bank (WB WDI)
| Country | Latest | Date | Trend |
|---|---|---|---|
| Congo, Dem. Rep.COD | 57.41% | 2012 | |
| BurundiBDI | 53.89% | 2013 | |
| MadagascarMDG | 52.01% | 2012 | |
| Central African RepublicCAF | 48.87% | 2021 | |
| EswatiniSWZ | 41.32% | 2000 | — |
| MalawiMWI | 41.11% | 2019 | |
| NigeriaNGA | 38.99% | 2022 | |
| Sierra LeoneSLE | 37.19% | 2018 | |
| MaliMLI | 35.02% | 2022 | |
| NigerNER | 33.61% | 2021 | |
| LiberiaLBR | 33.39% | 2016 | |
| Congo, Rep.COG | 32.53% | 2011 | |
| ArgentinaARG | 32.02% | 2017 | — |
| RwandaRWA | 31.94% | 2016 | |
| TanzaniaTZA | 31.52% | 2020 | |
| Guinea-BissauGNB | 31.31% | 2021 | |
| PhilippinesPHL | 30.95% | 2015 | |
| South SudanSSD | 30.84% | 2016 | |
| GuineaGIN | 30.49% | 2018 | |
| Burkina FasoBFA | 30.33% | 2021 | |
| IndiaIND | 29.21% | 2011 | |
| CameroonCMR | 28.98% | 2022 | |
| MozambiqueMOZ | 28.73% | 2019 | |
| UgandaUGA | 28.68% | 2019 | |
| LesothoLSO | 28.11% | 2017 | — |
| SudanSDN | 27.69% | 2014 | |
| ComorosCOM | 27.21% | 2014 | — |
| ChadTCD | 26.77% | 2018 | |
| AngolaAGO | 26.69% | 2018 | |
| NamibiaNAM | 26.58% | 2015 | |
| PakistanPAK | 25.44% | 2018 | |
| HondurasHND | 25.1% | 2004 | — |
| Gambia, TheGMB | 24.81% | 2015 | |
| TajikistanTJK | 24.66% | 2018 | |
| IndonesiaIDN | 24.54% | 2023 | |
| BeninBEN | 24.51% | 2021 | |
| SenegalSEN | 24.49% | 2021 | |
| TogoTGO | 23.19% | 2021 | |
| ZambiaZMB | 23.19% | 2010 | |
| KenyaKEN | 23.04% | 2015 | |
| EthiopiaETH | 22.27% | 2021 | |
| Cote d'IvoireCIV | 21.72% | 2021 | |
| IraqIRQ | 21.1% | 2017 | |
| Cabo VerdeCPV | 20.34% | 2015 | |
| Yemen, Rep.YEM | 20.33% | 2014 | |
| South AfricaZAF | 20.25% | 2014 | |
| UzbekistanUZB | 20.22% | 2003 | |
| ChinaCHN | 20.15% | 2018 | |
| GhanaGHA | 20.04% | 2016 | |
| PeruPER | 19.75% | 2022 |
Source: World Bank (WB WDI)