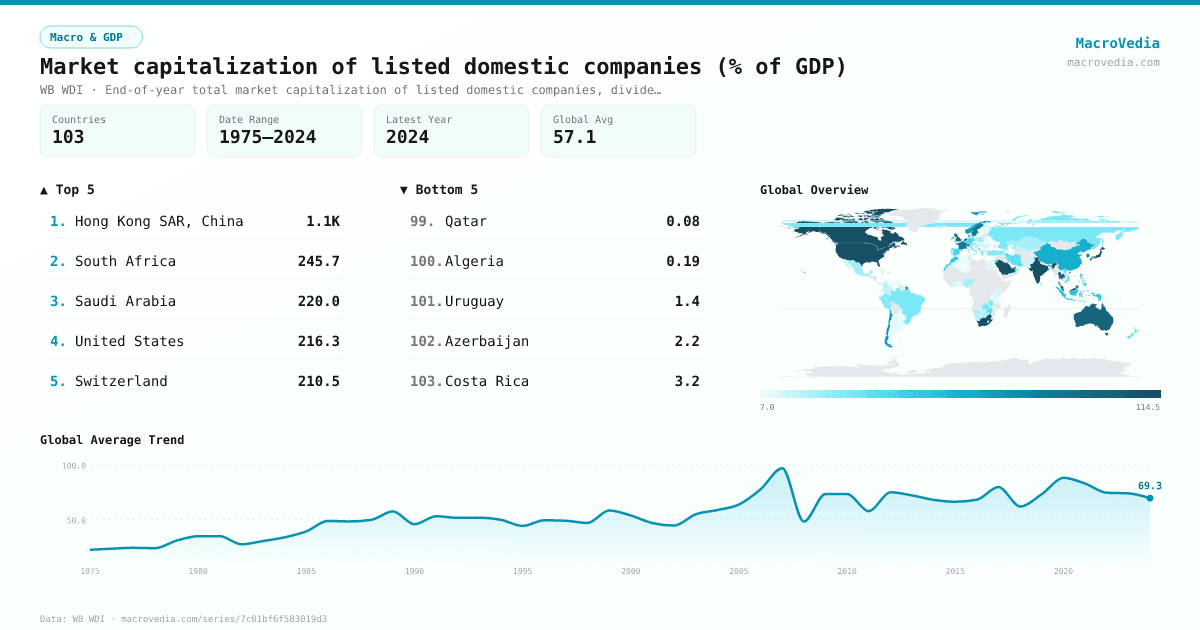
Market capitalization of listed domestic companies (% of GDP)
Macro & GDPWB WDIwb_wdi:CM.MKT.LCAP.GD.ZS•End-of-year total market capitalization of listed domestic companies, divided by gross domestic product, expressed as a percentage.•1975 → 2024•103 countries
Series quick facts
High-level context for this country series.
Macro & GDPWB WDI
Coverage
103
Frequency
yearly
Range
1975 \u2192 2024
Latest
2024
Market capitalization of listed domestic companies (% of GDP) by country
Latest available value per country (as of 2024)
Low \u2192 High
Unit: %
≤ 8.84%
8.84% – 17.2%
17.2% – 22.56%
22.56% – 36.31%
36.31% – 58.78%
58.78% – 98.77%
> 98.77%
No data
Generated by MacroVedia.comSource: World Bank (WB WDI)
Highest 15 countries
Market capitalization of listed domestic companies (% of GDP)
50 countries with data
Generated by MacroVedia.comSource: World Bank (WB WDI)
Distribution across countries
Market capitalization of listed domestic companies (% of GDP)
Countries
50
Median
67.5%
Mean
114.3%
25th pctl
44.9%
75th pctl
116.5%
Generated by MacroVedia.comSource: World Bank (WB WDI)
Compare trends
Market capitalization of listed domestic companies (% of GDP)
Hong Kong SAR, ChinaSouth AfricaUnited States
Generated by MacroVedia.comSource: World Bank (WB WDI)
| Country | Latest | Date | Trend |
|---|---|---|---|
| Hong Kong SAR, ChinaHKG | 1,118.24% | 2024 | |
| Iran, Islamic Rep.IRN | 450.18% | 2023 | |
| South AfricaZAF | 245.72% | 2024 | |
| Saudi ArabiaSAU | 219.95% | 2024 | |
| United StatesUSA | 216.29% | 2024 | |
| SwitzerlandCHE | 210.49% | 2024 | |
| United Arab EmiratesARE | 190.86% | 2024 | |
| JapanJPN | 156.69% | 2024 | |
| BotswanaBWA | 152.67% | 2022 | |
| CanadaCAN | 150.4% | 2024 | |
| IndiaIND | 131.24% | 2024 | |
| NetherlandsNLD | 129.69% | 2017 | |
| SingaporeSGP | 116.49% | 2024 | |
| MalaysiaMYS | 106.45% | 2024 | |
| AustraliaAUS | 98.87% | 2024 | |
| ThailandTHA | 98.7% | 2024 | |
| United KingdomGBR | 97.32% | 2022 | |
| MontenegroMNE | 93.01% | 2012 | |
| KuwaitKWT | 88.3% | 2024 | |
| SwedenSWE | 86.77% | 2003 | |
| FranceFRA | 85.06% | 2018 | |
| Korea, Rep.KOR | 83.05% | 2024 | |
| ChileCHL | 79.33% | 2024 | |
| QatarQAT | 78.94% | 2023 | |
| NorwayNOR | 72.31% | 2019 | |
| ChinaCHN | 62.72% | 2024 | |
| IsraelISR | 61.23% | 2024 | |
| MauritiusMUS | 61.09% | 2024 | |
| DenmarkDNK | 60.06% | 2004 | |
| BelgiumBEL | 59.17% | 2018 | |
| JamaicaJAM | 56.46% | 2024 | |
| IndonesiaIDN | 55.3% | 2023 | |
| PhilippinesPHL | 54.55% | 2024 | |
| BarbadosBRB | 51.42% | 2020 | |
| JordanJOR | 46.68% | 2024 | |
| MoroccoMAR | 46.36% | 2024 | |
| LebanonLBN | 45.73% | 2021 | |
| LuxembourgLUX | 44.88% | 2024 | |
| Trinidad and TobagoTTO | 44.07% | 2001 | |
| SpainESP | 43.69% | 2024 | |
| GermanyDEU | 43.63% | 2024 | |
| BahrainBHR | 43.32% | 2024 | |
| Viet NamVNM | 42.95% | 2024 | |
| SeychellesSYC | 37.42% | 2024 | |
| ZimbabweZWE | 35.86% | 1999 | |
| New ZealandNZL | 35.69% | 2024 | |
| GreeceGRC | 32.47% | 2024 | |
| Russian FederationRUS | 31.4% | 2023 | |
| ZambiaZMB | 30.69% | 2024 | |
| BrazilBRA | 30.14% | 2024 |
Source: World Bank (WB WDI)