Net official aid received (constant 2023 US$)
Macro & GDPWB WDIwb_wdi:DT.ODA.OATL.KD•nan•1990 → 2021•40 countries
Series quick facts
High-level context for this country series.
Macro & GDPWB WDI
Coverage
40
Frequency
yearly
Range
1990 \u2192 2021
Latest
2021
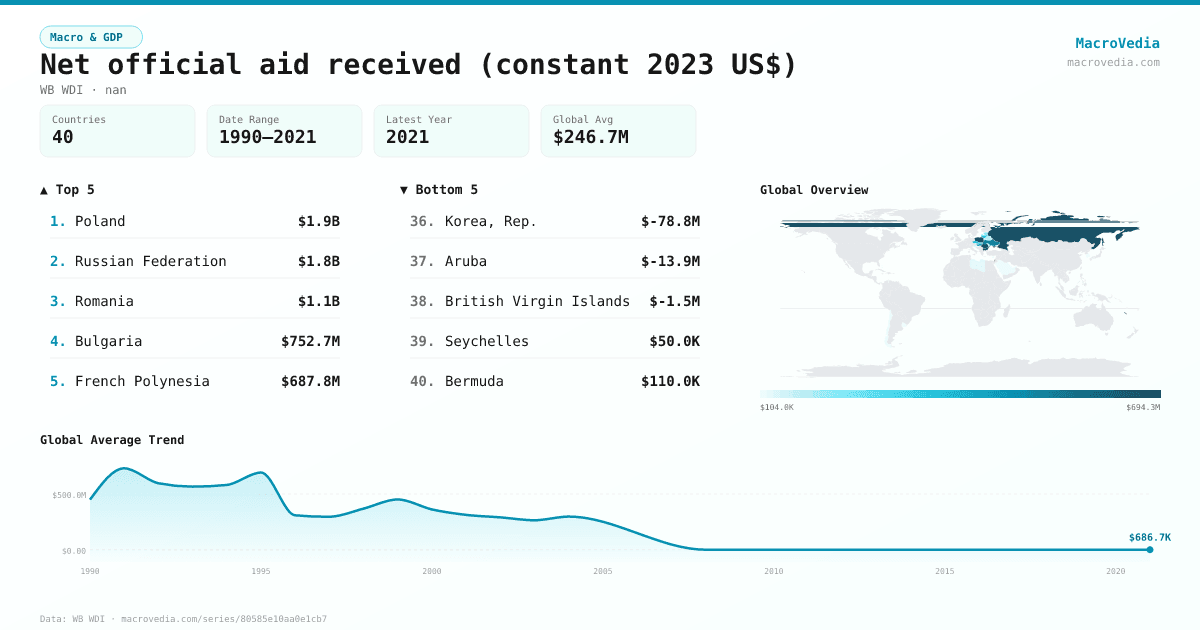
Net official aid received (constant 2023 US$) by country
Latest available value per country (as of 2021)
Low \u2192 High
Unit: US$
≤ 187.14K
187.14K – 755.71K
755.71K – 6.57M
6.57M – 66.92M
66.92M – 270.06M
270.06M – 644.65M
> 644.65M
No data
Generated by MacroVedia.comSource: World Bank (WB WDI)
Highest 15 countries
Net official aid received (constant 2023 US$)
40 countries with data
Generated by MacroVedia.comSource: World Bank (WB WDI)
Distribution across countries
Net official aid received (constant 2023 US$)
Countries
40
Median
$9.66M
Mean
$242.94M
25th pctl
$740K
75th pctl
$368.51M
Generated by MacroVedia.comSource: World Bank (WB WDI)
Compare trends
Net official aid received (constant 2023 US$)
PolandRussian FederationRomania
Generated by MacroVedia.comSource: World Bank (WB WDI)
| Country | Latest | Date | Trend |
|---|---|---|---|
| PolandPOL | $1.87B | 2004 | |
| Russian FederationRUS | $1.76B | 2004 | |
| RomaniaROU | $1.11B | 2004 | |
| BulgariaBGR | $752.73M | 2004 | |
| French PolynesiaPYF | $687.82M | 2004 | |
| IsraelISR | $674.2M | 2004 | |
| New CaledoniaNCL | $622.49M | 2004 | |
| LithuaniaLTU | $507.67M | 2003 | |
| UkraineUKR | $492.82M | 2004 | |
| HungaryHUN | $368.51M | 2004 | |
| CzechiaCZE | $340.18M | 2004 | |
| Slovak RepublicSVK | $282.02M | 2004 | |
| LatviaLVA | $198.32M | 2004 | |
| EstoniaEST | $165.96M | 2004 | |
| MoldovaMDA | $93.58M | 1995 | |
| SloveniaSVN | $76.24M | 2004 | |
| CyprusCYP | $73.42M | 2004 | |
| BelarusBLR | $64.32M | 2004 | |
| LibyaLBY | $14.53M | 2004 | |
| SingaporeSGP | $10.59M | 2004 | |
| Hong Kong SAR, ChinaHKG | $8.73M | 2004 | |
| MaltaMLT | $7.64M | 2004 | |
| Bahamas, TheBHS | $6.62M | 2004 | |
| United Arab EmiratesARE | $6.43M | 2004 | |
| KuwaitKWT | $4.45M | 2004 | |
| QatarQAT | $4.42M | 2004 | |
| ChileCHL | $1.27M | 2021 | — |
| Brunei DarussalamBRN | $850K | 2004 | |
| Saudi ArabiaSAU | $740K | 2008 | — |
| UruguayURY | $740K | 2021 | — |
| Cayman IslandsCYM | $530K | 2004 | |
| CroatiaHRV | $260K | 2011 | — |
| Northern Mariana IslandsMNP | $260K | 2000 | — |
| GibraltarGIB | $230K | 2004 | |
| Macao SAR, ChinaMAC | $130K | 2004 | |
| BermudaBMU | $110K | 2004 | |
| SeychellesSYC | $50K | 2021 | — |
| British Virgin IslandsVGB | -$1.5M | 2004 | |
| ArubaABW | -$13.88M | 2004 | |
| Korea, Rep.KOR | -$474.36M | 2003 |
Source: World Bank (WB WDI)