Labor force with advanced education, female (% of female working-age population with advanced education)
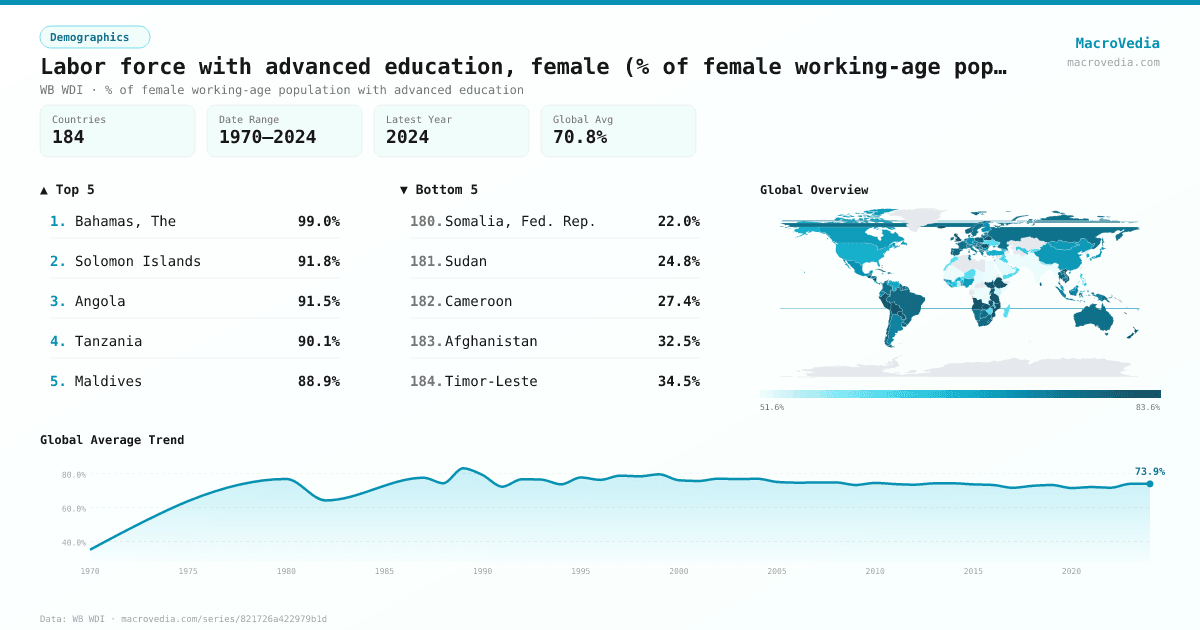
DemographicsWB WDIwb_wdi:SL.TLF.ADVN.FE.ZS•% of female working-age population with advanced education•1970 → 2024•184 countries
Series quick facts
High-level context for this country series.
DemographicsWB WDI
Coverage
184
Frequency
—
Range
1970 \u2192 2024
Latest
2024
Labor force with advanced education, female (% of female working-age population with advanced education) by country
Latest available value per country (as of 2024)
Low \u2192 High
Unit: %
≤ 56.51%
56.51% – 67.65%
67.65% – 72.26%
72.26% – 76.71%
76.71% – 79.47%
79.47% – 82.39%
> 82.39%
No data
Generated by MacroVedia.comSource: World Bank (WB WDI)
Highest 15 countries
Labor force with advanced education, female (% of female working-age population with advanced education)
50 countries with data
Generated by MacroVedia.comSource: World Bank (WB WDI)
Distribution across countries
Labor force with advanced education, female (% of female working-age population with advanced education)
Countries
50
Median
82.8%
Mean
83.8%
25th pctl
81%
75th pctl
85.7%
Generated by MacroVedia.comSource: World Bank (WB WDI)
Compare trends
Labor force with advanced education, female (% of female working-age population with advanced education)
PortugalUnited KingdomIreland
Generated by MacroVedia.comSource: World Bank (WB WDI)
| Country | Latest | Date | Trend |
|---|---|---|---|
| Bahamas, TheBHS | 99.03% | 2023 | |
| Solomon IslandsSLB | 91.8% | 2013 | — |
| AngolaAGO | 91.5% | 2021 | |
| TanzaniaTZA | 90.13% | 2024 | |
| MaldivesMDV | 88.95% | 2019 | |
| MontenegroMNE | 88.32% | 2023 | |
| Macao SAR, ChinaMAC | 88.31% | 2016 | |
| NauruNRU | 87.41% | 2021 | |
| Viet NamVNM | 87.17% | 2024 | |
| EthiopiaETH | 87.05% | 2021 | |
| South SudanSSD | 86.44% | 2008 | — |
| MaltaMLT | 86.4% | 2024 | |
| MozambiqueMOZ | 85.68% | 2022 | |
| GuatemalaGTM | 84.89% | 2024 | |
| IcelandISL | 84.64% | 2024 | |
| TuvaluTUV | 84.02% | 2022 | |
| New CaledoniaNCL | 83.98% | 2023 | |
| LesothoLSO | 83.87% | 2024 | |
| Cayman IslandsCYM | 83.77% | 2015 | |
| Marshall IslandsMHL | 83.35% | 2021 | |
| AlbaniaALB | 83.27% | 2023 | |
| United KingdomGBR | 83.21% | 2024 | |
| SeychellesSYC | 83.16% | 2024 | |
| KiribatiKIR | 83.01% | 2023 | |
| PortugalPRT | 82.93% | 2024 | |
| ParaguayPRY | 82.75% | 2017 | |
| SingaporeSGP | 82.4% | 2024 | |
| BoliviaBOL | 82.32% | 2024 | |
| Bosnia and HerzegovinaBIH | 82.32% | 2024 | |
| BelarusBLR | 82.05% | 2024 | |
| ZambiaZMB | 82.04% | 2023 | |
| RomaniaROU | 81.9% | 2024 | |
| NicaraguaNIC | 81.63% | 2014 | |
| BelizeBLZ | 81.51% | 2019 | |
| Antigua and BarbudaATG | 81.42% | 2018 | — |
| UgandaUGA | 81.17% | 2021 | |
| PeruPER | 81.11% | 2024 | |
| New ZealandNZL | 81.02% | 2020 | |
| BarbadosBRB | 80.86% | 2023 | |
| CyprusCYP | 80.83% | 2024 | |
| Slovak RepublicSVK | 80.52% | 2024 | |
| Dominican RepublicDOM | 80.47% | 2024 | |
| Sri LankaLKA | 80.4% | 2023 | |
| SloveniaSVN | 80.31% | 2024 | |
| ThailandTHA | 80.02% | 2024 | |
| IrelandIRL | 79.98% | 2024 | |
| ChileCHL | 79.95% | 2024 | |
| PolandPOL | 79.91% | 2024 | |
| MauritiusMUS | 79.84% | 2024 | |
| SurinameSUR | 79.81% | 2016 |
Source: World Bank (WB WDI)