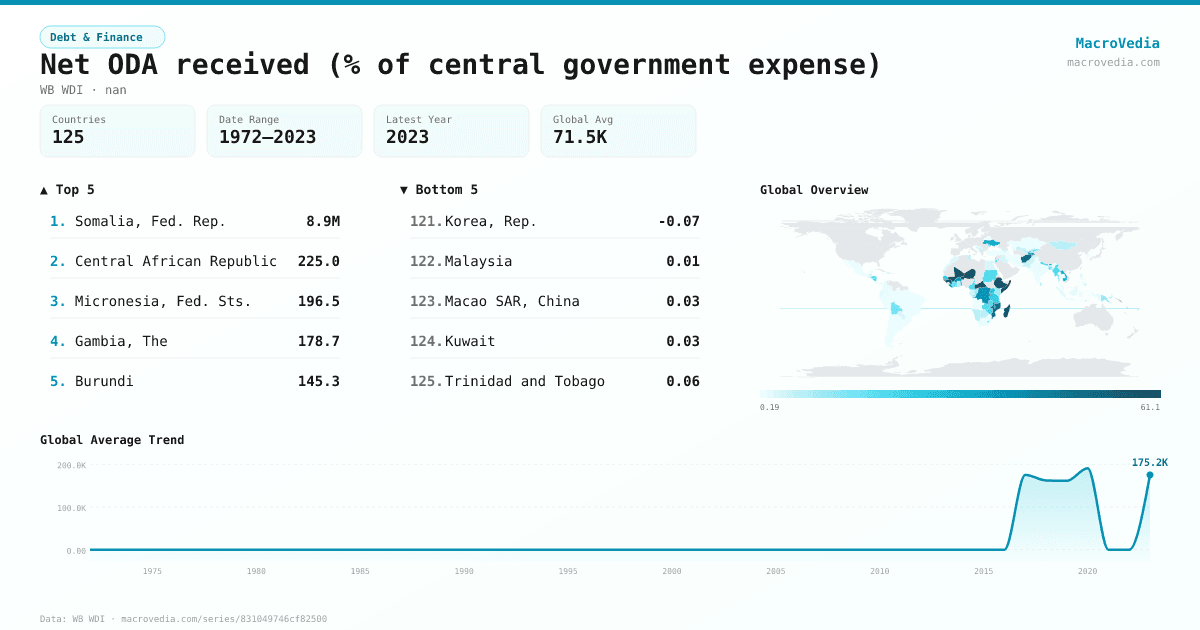
Net ODA received (% of central government expense)
Debt & FinanceWB WDIwb_wdi:DT.ODA.ODAT.XP.ZS•nan•1972 → 2023•125 countries
Series quick facts
High-level context for this country series.
Debt & FinanceWB WDI
Coverage
125
Frequency
—
Range
1972 \u2192 2023
Latest
2023
Net ODA received (% of central government expense) by country
Latest available value per country (as of 2023)
Low \u2192 High
Unit: %
≤ 0.58%
0.58% – 2.62%
2.62% – 5.68%
5.68% – 16.18%
16.18% – 29.2%
29.2% – 52.22%
> 52.22%
No data
Generated by MacroVedia.comSource: World Bank (WB WDI)
Highest 15 countries
Net ODA received (% of central government expense)
50 countries with data
Generated by MacroVedia.comSource: World Bank (WB WDI)
Distribution across countries
Net ODA received (% of central government expense)
Countries
50
Median
42.6%
Mean
331,939.4%
25th pctl
28.3%
75th pctl
64.9%
Generated by MacroVedia.comSource: World Bank (WB WDI)
Compare trends
Net ODA received (% of central government expense)
BhutanEthiopiaNicaragua
Generated by MacroVedia.comSource: World Bank (WB WDI)
| Country | Latest | Date | Trend |
|---|---|---|---|
| Somalia, Fed. Rep.SOM | 16,594,098.04% | 2020 | |
| Central African RepublicCAF | 224.99% | 2021 | |
| Micronesia, Fed. Sts.FSM | 196.47% | 2020 | |
| Gambia, TheGMB | 178.75% | 1990 | — |
| BurundiBDI | 145.28% | 2021 | |
| GuineaGIN | 144.36% | 1992 | |
| TongaTON | 132.69% | 2022 | |
| Marshall IslandsMHL | 127.38% | 2020 | |
| LebanonLBN | 96.49% | 2021 | |
| MadagascarMDG | 70.84% | 2023 | |
| Congo, Dem. Rep.COD | 70.71% | 2021 | |
| EthiopiaETH | 64.94% | 2023 | |
| NigerNER | 64.88% | 1980 | |
| MaliMLI | 61.89% | 2020 | |
| Solomon IslandsSLB | 59.83% | 2022 | |
| Guinea-BissauGNB | 58.55% | 2023 | |
| MalawiMWI | 54.69% | 2022 | |
| MozambiqueMOZ | 52.43% | 2022 | |
| RwandaRWA | 52.14% | 2023 | |
| AfghanistanAFG | 51.82% | 2017 | |
| NauruNRU | 48.48% | 2019 | |
| VanuatuVUT | 47.45% | 2023 | |
| West Bank and GazaPSE | 45.64% | 2021 | |
| PalauPLW | 43.38% | 2020 | |
| NicaraguaNIC | 43.21% | 2022 | |
| SamoaWSM | 42.02% | 2023 | |
| KiribatiKIR | 40.29% | 2023 | |
| MyanmarMMR | 39.53% | 2018 | |
| TogoTGO | 39.49% | 2023 | |
| TajikistanTJK | 39.34% | 2023 | |
| Burkina FasoBFA | 36.5% | 2023 | |
| LiberiaLBR | 36.47% | 1982 | — |
| BhutanBTN | 34.43% | 2020 | |
| Lao PDRLAO | 34.3% | 2022 | |
| UkraineUKR | 32.77% | 2023 | |
| BoliviaBOL | 29.46% | 2006 | |
| CambodiaKHM | 28.84% | 2023 | |
| Cabo VerdeCPV | 28.31% | 2020 | |
| UgandaUGA | 27.9% | 2023 | |
| SenegalSEN | 25.71% | 2023 | |
| Kyrgyz RepublicKGZ | 25.42% | 2022 | |
| FijiFJI | 24.23% | 2022 | |
| MaldivesMDV | 23.78% | 2020 | |
| TanzaniaTZA | 22.71% | 2023 | |
| NepalNPL | 22.29% | 2021 | |
| ZimbabweZWE | 21.2% | 2018 | |
| HondurasHND | 20.79% | 2020 | |
| CameroonCMR | 20.43% | 2021 | |
| ZambiaZMB | 19.61% | 2021 | |
| SudanSDN | 19.51% | 2016 |
Source: World Bank (WB WDI)