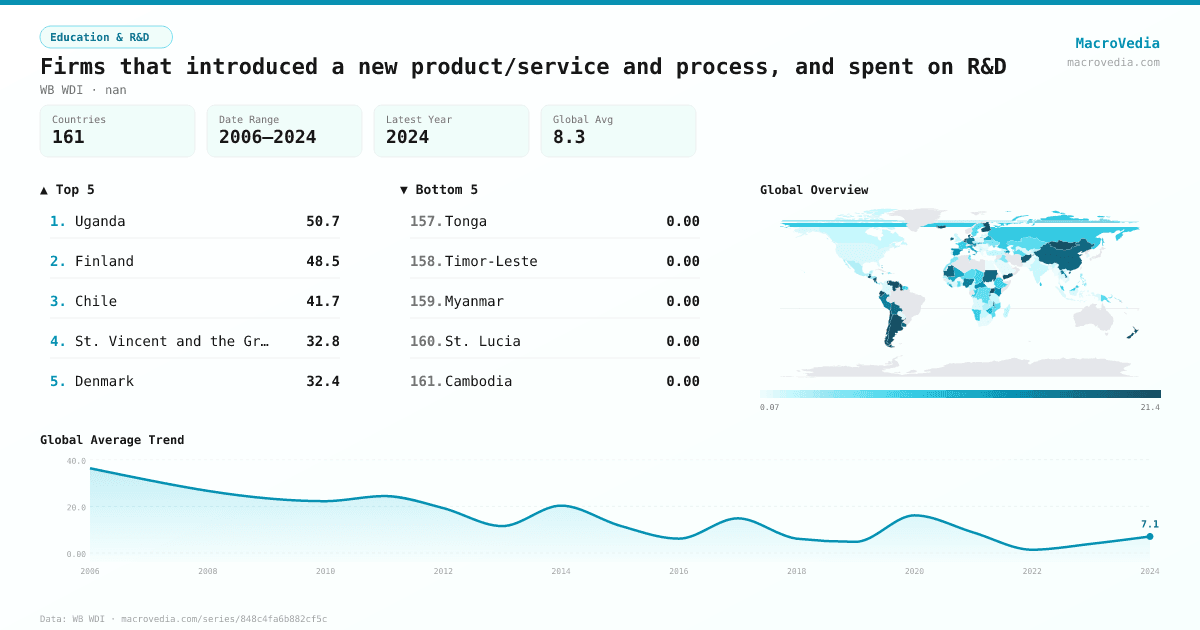
Firms that introduced a new product/service and process, and spent on R&D
Education & R&DWB WDIwb_wdi:IC.FRM.NPRD.ZS•nan•2006 → 2024•161 countries
Series quick facts
High-level context for this country series.
Education & R&DWB WDI
Coverage
161
Frequency
—
Range
2006 \u2192 2024
Latest
2024
Firms that introduced a new product/service and process, and spent on R&D by country
Latest available value per country (as of 2024)
Low \u2192 High
Unit: nan
≤ 1.72K
1.72K – 5.35K
5.35K – 8.28K
8.28K – 12.6K
12.6K – 16.69K
16.69K – 23.5K
> 23.5K
No data
Generated by MacroVedia.comSource: World Bank (WB WDI)
Highest 15 countries
Firms that introduced a new product/service and process, and spent on R&D
50 countries with data
Generated by MacroVedia.comSource: World Bank (WB WDI)
Distribution across countries
Firms that introduced a new product/service and process, and spent on R&D
Countries
50
Median
23.4K
Mean
25.6K
25th pctl
18.2K
75th pctl
28.9K
Generated by MacroVedia.comSource: World Bank (WB WDI)
Compare trends
Firms that introduced a new product/service and process, and spent on R&D
EcuadorUruguayColombia
Generated by MacroVedia.comSource: World Bank (WB WDI)
| Country | Latest | Date | Trend |
|---|---|---|---|
| UgandaUGA | 50.72K nan | 2013 | — |
| BoliviaBOL | 50.13K nan | 2010 | |
| FinlandFIN | 48.52K nan | 2020 | — |
| NamibiaNAM | 45.14K nan | 2014 | — |
| ZimbabweZWE | 42.49K nan | 2011 | — |
| ChileCHL | 41.75K nan | 2010 | |
| St. Vincent and the GrenadinesVCT | 32.79K nan | 2010 | — |
| DenmarkDNK | 32.4K nan | 2020 | — |
| HondurasHND | 31.54K nan | 2010 | |
| Congo, Dem. Rep.COD | 30.71K nan | 2013 | — |
| PanamaPAN | 30.03K nan | 2006 | — |
| KenyaKEN | 29.29K nan | 2013 | — |
| GrenadaGRD | 28.95K nan | 2010 | — |
| Venezuela, RBVEN | 28.56K nan | 2010 | — |
| Central African RepublicCAF | 28.37K nan | 2011 | — |
| EcuadorECU | 28.31K nan | 2024 | |
| GhanaGHA | 27.05K nan | 2013 | — |
| IndiaIND | 26.28K nan | 2014 | — |
| BurundiBDI | 25.06K nan | 2014 | — |
| Yemen, Rep.YEM | 24.77K nan | 2013 | — |
| BelgiumBEL | 24.47K nan | 2024 | |
| NetherlandsNLD | 24.05K nan | 2020 | — |
| CambodiaKHM | 23.67K nan | 2016 | |
| MongoliaMNG | 23.47K nan | 2019 | |
| ColombiaCOL | 23.46K nan | 2017 | |
| GuyanaGUY | 23.34K nan | 2010 | — |
| SloveniaSVN | 22.28K nan | 2024 | |
| SwedenSWE | 22.01K nan | 2020 | |
| GuatemalaGTM | 21.78K nan | 2017 | |
| IcelandISL | 21.44K nan | 2024 | — |
| ArgentinaARG | 20.98K nan | 2017 | |
| New ZealandNZL | 20.84K nan | 2023 | — |
| ZambiaZMB | 20.73K nan | 2013 | — |
| BarbadosBRB | 20.63K nan | 2010 | — |
| NicaraguaNIC | 19.9K nan | 2016 | |
| AfghanistanAFG | 19.54K nan | 2014 | — |
| SudanSDN | 18.25K nan | 2014 | — |
| UruguayURY | 18.16K nan | 2024 | |
| ChinaCHN | 18.16K nan | 2024 | |
| IrelandIRL | 17.9K nan | 2024 | |
| Papua New GuineaPNG | 17.77K nan | 2015 | — |
| Dominican RepublicDOM | 17.71K nan | 2010 | — |
| MauritaniaMRT | 17.68K nan | 2014 | — |
| EthiopiaETH | 17.57K nan | 2011 | — |
| MexicoMEX | 17.26K nan | 2010 | |
| LebanonLBN | 16.77K nan | 2013 | — |
| South SudanSSD | 16.66K nan | 2014 | — |
| Viet NamVNM | 16.13K nan | 2015 | — |
| GermanyDEU | 16.06K nan | 2021 | — |
| Costa RicaCRI | 16K nan | 2023 |
Source: World Bank (WB WDI)