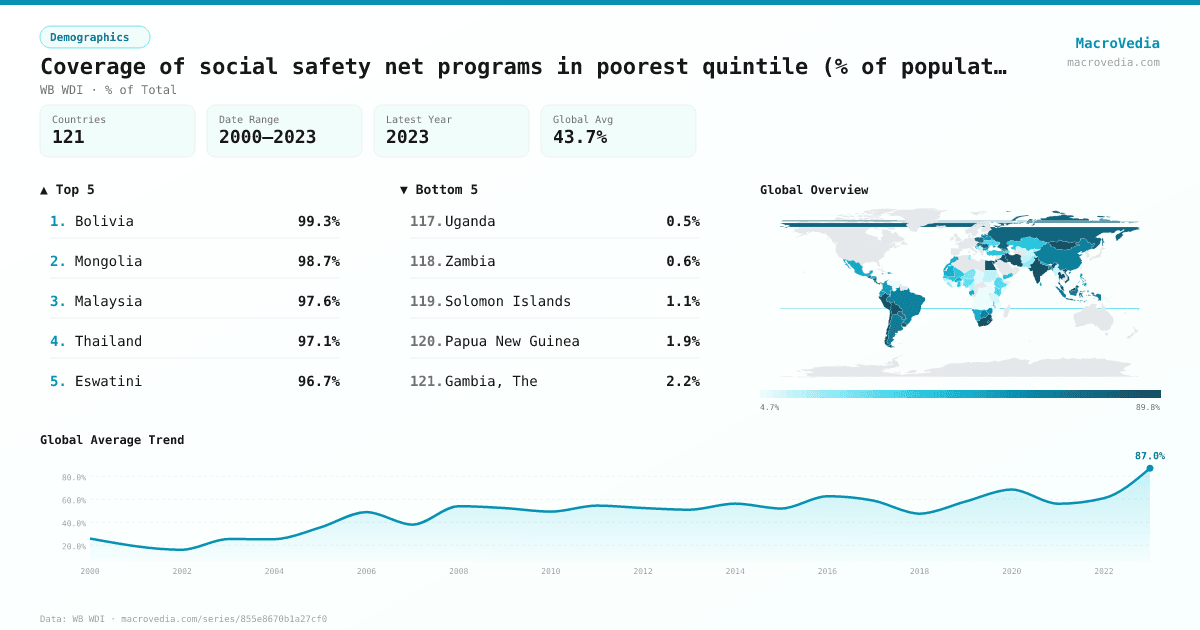
Coverage of social safety net programs in poorest quintile (% of population)
DemographicsWB WDIwb_wdi:per_sa_allsa.cov_q1_tot•% of Total•2000 → 2023•121 countries
Series quick facts
High-level context for this country series.
DemographicsWB WDI
Coverage
121
Frequency
yearly
Range
2000 \u2192 2023
Latest
2023
Coverage of social safety net programs in poorest quintile (% of population) by country
Latest available value per country (as of 2023)
Low \u2192 High
Unit: %
≤ 8.4%
8.4% – 20.73%
20.73% – 36.89%
36.89% – 50.05%
50.05% – 66.56%
66.56% – 83.14%
> 83.14%
No data
Generated by MacroVedia.comSource: World Bank (WB WDI)
Highest 15 countries
Coverage of social safety net programs in poorest quintile (% of population)
50 countries with data
Generated by MacroVedia.comSource: World Bank (WB WDI)
Distribution across countries
Coverage of social safety net programs in poorest quintile (% of population)
Countries
50
Median
74.5%
Mean
75.9%
25th pctl
63.3%
75th pctl
89.8%
Generated by MacroVedia.comSource: World Bank (WB WDI)
Compare trends
Coverage of social safety net programs in poorest quintile (% of population)
ParaguayPeruArmenia
Generated by MacroVedia.comSource: World Bank (WB WDI)
| Country | Latest | Date | Trend |
|---|---|---|---|
| BoliviaBOL | 99.34% | 2021 | |
| MongoliaMNG | 98.75% | 2020 | |
| MalaysiaMYS | 97.63% | 2016 | |
| ThailandTHA | 97.08% | 2021 | |
| EswatiniSWZ | 96.75% | 2016 | |
| Slovak RepublicSVK | 95.61% | 2009 | — |
| PeruPER | 95.31% | 2022 | |
| South AfricaZAF | 94.58% | 2021 | |
| Egypt, Arab Rep.EGY | 94.09% | 2019 | |
| ChileCHL | 92.78% | 2022 | |
| IndiaIND | 92.76% | 2011 | |
| El SalvadorSLV | 91.29% | 2022 | |
| Iran, Islamic Rep.IRN | 89.77% | 2020 | |
| LesothoLSO | 89.64% | 2017 | |
| Viet NamVNM | 88.55% | 2020 | |
| PanamaPAN | 87% | 2023 | |
| IraqIRQ | 86.12% | 2012 | |
| JordanJOR | 83.31% | 2010 | |
| UruguayURY | 82.12% | 2022 | |
| Costa RicaCRI | 81.85% | 2022 | |
| HungaryHUN | 81.31% | 2007 | — |
| RomaniaROU | 79.02% | 2021 | |
| Russian FederationRUS | 77.56% | 2017 | |
| UgandaUGA | 75.69% | 2012 | |
| GeorgiaGEO | 74.61% | 2021 | |
| NicaraguaNIC | 74.29% | 2014 | |
| ParaguayPRY | 73.33% | 2022 | |
| PolandPOL | 71.79% | 2019 | |
| GuatemalaGTM | 71.65% | 2014 | |
| JamaicaJAM | 70.55% | 2017 | |
| IndonesiaIDN | 69.39% | 2022 | |
| BangladeshBGD | 69.34% | 2022 | |
| ArgentinaARG | 68.86% | 2022 | |
| LithuaniaLTU | 68.09% | 2008 | — |
| LatviaLVA | 67.17% | 2009 | |
| ChinaCHN | 65.04% | 2013 | — |
| BrazilBRA | 64.28% | 2022 | |
| BotswanaBWA | 63.34% | 2015 | |
| BelarusBLR | 60.81% | 2019 | |
| ArmeniaARM | 59.74% | 2022 | |
| ZimbabweZWE | 58.96% | 2019 | |
| CroatiaHRV | 58.89% | 2014 | |
| BulgariaBGR | 57.58% | 2007 | — |
| PhilippinesPHL | 57.24% | 2018 | |
| Dominican RepublicDOM | 56.96% | 2021 | |
| EcuadorECU | 56.45% | 2022 | |
| ColombiaCOL | 54.04% | 2022 | |
| GabonGAB | 51.7% | 2017 | |
| MexicoMEX | 51.58% | 2022 | |
| HondurasHND | 50.39% | 2019 |
Source: World Bank (WB WDI)