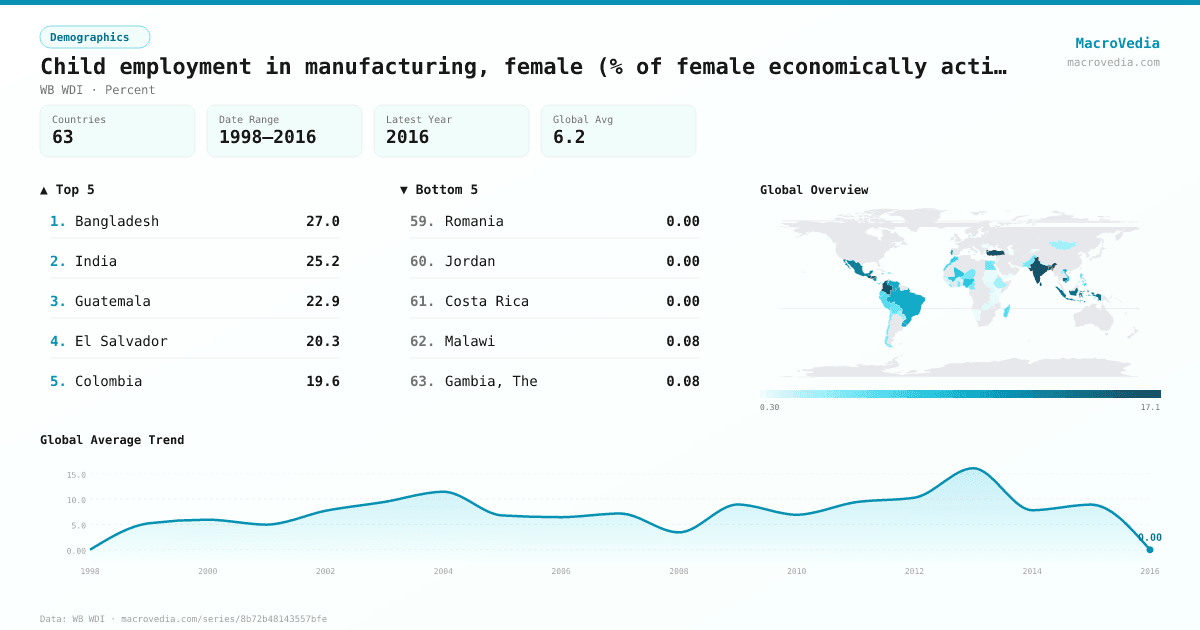
Child employment in manufacturing, female (% of female economically active children ages 7-
DemographicsWB WDIwb_wdi:SL.MNF.0714.FE.ZS•Percent•1998 → 2016•63 countries
Series quick facts
High-level context for this country series.
DemographicsWB WDI
Coverage
63
Frequency
—
Range
1998 \u2192 2016
Latest
2015
Child employment in manufacturing, female (% of female economically active children ages 7- by country
Latest available value per country (as of 2015)
Low \u2192 High
Unit: %
≤ 0.46%
0.46% – 1.45%
1.45% – 3.53%
3.53% – 5.22%
5.22% – 8.61%
8.61% – 14.96%
> 14.96%
No data
Generated by MacroVedia.comSource: World Bank (WB WDI)
Highest 15 countries
Child employment in manufacturing, female (% of female economically active children ages 7-
50 countries with data
Generated by MacroVedia.comSource: World Bank (WB WDI)
Distribution across countries
Child employment in manufacturing, female (% of female economically active children ages 7-
Countries
50
Median
6%
Mean
8.3%
25th pctl
2.8%
75th pctl
11.6%
Generated by MacroVedia.comSource: World Bank (WB WDI)
Compare trends
Child employment in manufacturing, female (% of female economically active children ages 7-
BrazilGuatemalaEl Salvador
Generated by MacroVedia.comSource: World Bank (WB WDI)
| Country | Latest | Date | Trend |
|---|---|---|---|
| BangladeshBGD | 26.98% | 2013 | |
| IndiaIND | 25.22% | 2012 | |
| GuatemalaGTM | 22.94% | 2015 | |
| El SalvadorSLV | 20.29% | 2013 | |
| ColombiaCOL | 19.56% | 2015 | |
| HondurasHND | 19.34% | 2014 | |
| TurkiyeTUR | 17.2% | 2006 | |
| Costa RicaCRI | 16.83% | 2011 | |
| Sri LankaLKA | 16.73% | 2009 | |
| CambodiaKHM | 14.67% | 2012 | |
| IndonesiaIDN | 13.97% | 2010 | |
| MexicoMEX | 12.7% | 2013 | |
| JamaicaJAM | 11.6% | 2002 | — |
| PortugalPRT | 10.72% | 2001 | — |
| NicaraguaNIC | 10.72% | 2012 | |
| Venezuela, RBVEN | 9.66% | 2013 | |
| BrazilBRA | 9.34% | 2015 | |
| UruguayURY | 9.1% | 2009 | — |
| Viet NamVNM | 8.41% | 2012 | — |
| MaliMLI | 7.54% | 2007 | |
| PakistanPAK | 7.36% | 2008 | — |
| NigeriaNGA | 7.35% | 2010 | — |
| ParaguayPRY | 6.85% | 2005 | — |
| MoroccoMAR | 6.41% | 2004 | |
| PhilippinesPHL | 6.27% | 2011 | |
| EcuadorECU | 5.7% | 2015 | |
| PeruPER | 5.47% | 2007 | |
| PanamaPAN | 5.03% | 2014 | |
| MadagascarMDG | 4.88% | 2007 | |
| BoliviaBOL | 4.73% | 2015 | |
| Egypt, Arab Rep.EGY | 4.51% | 2009 | — |
| NigerNER | 4.2% | 2009 | — |
| CameroonCMR | 4.16% | 2007 | |
| Dominican RepublicDOM | 4.03% | 2012 | |
| ChileCHL | 3.67% | 2012 | |
| GhanaGHA | 3.6% | 2012 | |
| LiberiaLBR | 3.43% | 2010 | — |
| EthiopiaETH | 2.79% | 2005 | — |
| RwandaRWA | 2.72% | 2011 | |
| MongoliaMNG | 2.55% | 2012 | |
| Lao PDRLAO | 2.27% | 2010 | — |
| SenegalSEN | 1.78% | 2011 | |
| UgandaUGA | 1.71% | 2006 | — |
| GuineaGIN | 1.66% | 2010 | — |
| NepalNPL | 1.48% | 2008 | |
| Burkina FasoBFA | 1.39% | 2006 | |
| TogoTGO | 1.37% | 2010 | |
| AlbaniaALB | 1.36% | 2010 | — |
| Yemen, Rep.YEM | 0.8% | 1999 | — |
| ZambiaZMB | 0.76% | 2008 |
Source: World Bank (WB WDI)