Secondary education, vocational pupils (% female)
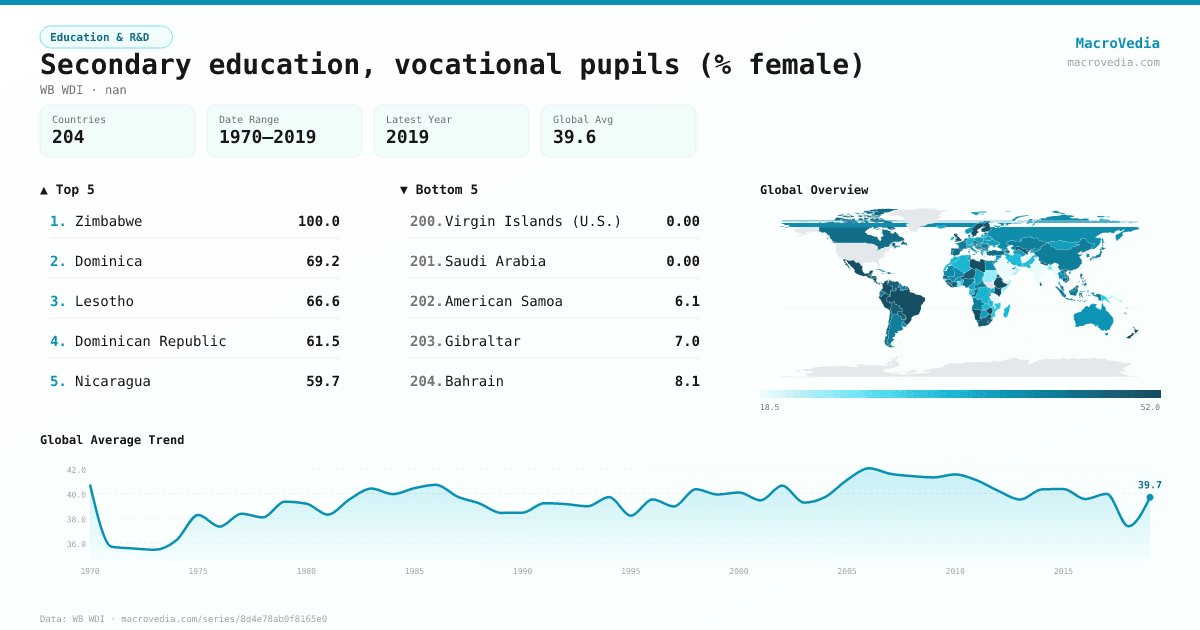
Education & R&DWB WDIwb_wdi:SE.SEC.ENRL.VO.FE.ZS•nan•1970 → 2019•204 countries
Series quick facts
High-level context for this country series.
Education & R&DWB WDI
Coverage
204
Frequency
yearly
Range
1970 \u2192 2019
Latest
2019
Secondary education, vocational pupils (% female) by country
Latest available value per country (as of 2019)
Low \u2192 High
Unit: %
≤ 30.04%
30.04% – 36.51%
36.51% – 39.75%
39.75% – 42.76%
42.76% – 46.67%
46.67% – 50.47%
> 50.47%
No data
Generated by MacroVedia.comSource: World Bank (WB WDI)
Highest 15 countries
Secondary education, vocational pupils (% female)
50 countries with data
Generated by MacroVedia.comSource: World Bank (WB WDI)
Distribution across countries
Secondary education, vocational pupils (% female)
Countries
50
Median
51.3%
Mean
53.5%
25th pctl
49.1%
75th pctl
54.6%
Generated by MacroVedia.comSource: World Bank (WB WDI)
Compare trends
Secondary education, vocational pupils (% female)
Costa RicaFinlandUnited Kingdom
Generated by MacroVedia.comSource: World Bank (WB WDI)
| Country | Latest | Date | Trend |
|---|---|---|---|
| ZimbabweZWE | 100% | 1986 | |
| DominicaDMA | 69.21% | 2011 | |
| LesothoLSO | 66.59% | 2017 | |
| Dominican RepublicDOM | 61.52% | 2018 | |
| NicaraguaNIC | 59.68% | 2010 | |
| KuwaitKWT | 58.41% | 2015 | |
| PeruPER | 58.4% | 2018 | |
| TuvaluTUV | 58.33% | 2016 | |
| KenyaKEN | 57.82% | 2009 | |
| New ZealandNZL | 56.1% | 2017 | |
| Sao Tome and PrincipeSTP | 56.02% | 2017 | |
| KiribatiKIR | 55.97% | 1996 | |
| BrazilBRA | 54.56% | 2017 | |
| Marshall IslandsMHL | 54.48% | 2016 | |
| British Virgin IslandsVGB | 54.43% | 2017 | |
| MexicoMEX | 53.59% | 2017 | |
| ColombiaCOL | 53.25% | 2018 | |
| LibyaLBY | 53.03% | 2003 | |
| French PolynesiaPYF | 52.9% | 1997 | |
| HondurasHND | 52.48% | 2017 | |
| EthiopiaETH | 52.33% | 2015 | |
| Costa RicaCRI | 52.26% | 2018 | |
| NamibiaNAM | 51.55% | 1997 | |
| SwedenSWE | 51.46% | 2017 | |
| VanuatuVUT | 51.4% | 2015 | |
| NepalNPL | 51.18% | 2019 | |
| GuatemalaGTM | 51.02% | 2018 | |
| BelgiumBEL | 50.55% | 2017 | |
| LiberiaLBR | 50.47% | 2011 | |
| FinlandFIN | 50.47% | 2017 | |
| United KingdomGBR | 50.35% | 2017 | |
| AzerbaijanAZE | 50.13% | 2018 | |
| El SalvadorSLV | 49.6% | 2018 | |
| ParaguayPRY | 49.43% | 2016 | |
| NigerNER | 49.19% | 2017 | |
| IsraelISR | 49.18% | 2017 | |
| San MarinoSMR | 49.07% | 2018 | |
| NetherlandsNLD | 49.07% | 2017 | |
| UzbekistanUZB | 49.01% | 2017 | |
| BoliviaBOL | 49% | 2018 | |
| LuxembourgLUX | 48.51% | 2017 | |
| South AfricaZAF | 48.5% | 2017 | |
| Turks and Caicos IslandsTCA | 48.48% | 1999 | |
| SenegalSEN | 48.45% | 2018 | |
| Venezuela, RBVEN | 48.39% | 2017 | |
| CuracaoCUW | 48.36% | 2013 | — |
| Cote d'IvoireCIV | 48.26% | 2018 | |
| SamoaWSM | 47.74% | 1980 | |
| BurundiBDI | 47.71% | 2018 | |
| GuineaGIN | 47.49% | 2014 |
Source: World Bank (WB WDI)