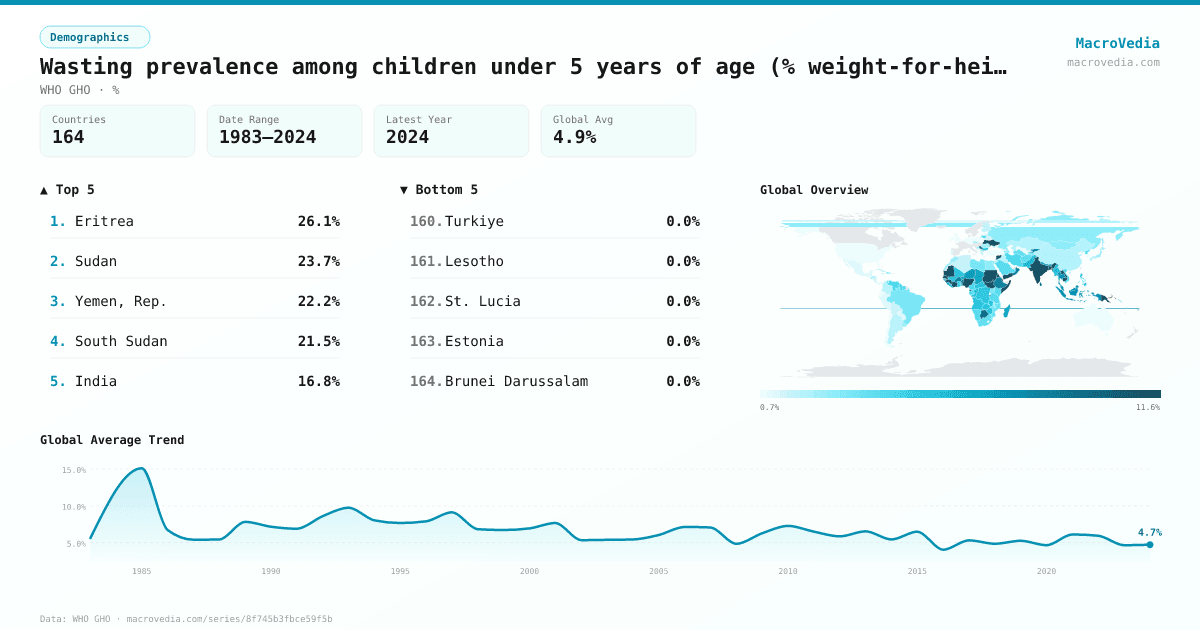
Wasting prevalence among children under 5 years of age (% weight-for-height <-2 SD), survey-based estimates
DemographicsWHO GHOwho_gho:NUTRITION_WH_2•%•1983 → 2024•164 countries
Series quick facts
High-level context for this country series.
DemographicsWHO GHO
Coverage
164
Frequency
—
Range
1983 \u2192 2024
Latest
2024
Wasting prevalence among children under 5 years of age (% weight-for-height <-2 SD), survey-based estimates by country
Latest available value per country (as of 2024)
Low \u2192 High
Unit: %
≤ 1.3%
1.3% – 2.4%
2.4% – 3.4%
3.4% – 5.01%
5.01% – 7.39%
7.39% – 11.67%
> 11.67%
No data
Generated by MacroVedia.comSource: World Health Organization (WHO GHO)
Highest 15 countries
Wasting prevalence among children under 5 years of age (% weight-for-height <-2 SD), survey-based estimates
50 countries with data
Generated by MacroVedia.comSource: World Health Organization (WHO GHO)
Distribution across countries
Wasting prevalence among children under 5 years of age (% weight-for-height <-2 SD), survey-based estimates
Countries
50
Median
11.6%
Mean
12.1%
25th pctl
8.6%
75th pctl
14.1%
Generated by MacroVedia.comSource: World Health Organization (WHO GHO)
Compare trends
Wasting prevalence among children under 5 years of age (% weight-for-height <-2 SD), survey-based estimates
BangladeshNigerSenegal
Generated by MacroVedia.comSource: World Health Organization (WHO GHO)
| Country | Latest | Date | Trend |
|---|---|---|---|
| EritreaERI | 26.1% | 2010 | |
| SudanSDN | 23.7% | 2014 | |
| Yemen, Rep.YEM | 22.2% | 2022 | |
| South SudanSSD | 21.5% | 2010 | |
| IndiaIND | 16.8% | 2020 | |
| CambodiaKHM | 16.7% | 2021 | |
| ChadTCD | 16.7% | 2021 | |
| PakistanPAK | 16.6% | 2013 | |
| MauritiusMUS | 15.7% | 1995 | |
| SenegalSEN | 15% | 2023 | |
| Egypt, Arab Rep.EGY | 14.8% | 2014 | |
| Somalia, Fed. Rep.SOM | 14.3% | 2009 | |
| Papua New GuineaPNG | 14.1% | 2010 | |
| MalaysiaMYS | 14% | 2019 | |
| MaliMLI | 13.7% | 2022 | |
| MauritaniaMRT | 13.6% | 2022 | |
| GuineaGIN | 13.2% | 2022 | |
| BangladeshBGD | 12.7% | 2022 | |
| KiribatiKIR | 12.6% | 1985 | — |
| NepalNPL | 12.5% | 2019 | |
| UkraineUKR | 12.3% | 2000 | — |
| Timor-LesteTLS | 12.2% | 2014 | |
| DjiboutiDJI | 12.1% | 2023 | |
| Cote d'IvoireCIV | 11.7% | 2021 | |
| NigeriaNGA | 11.6% | 2021 | |
| Lao PDRLAO | 11.5% | 2023 | |
| Syrian Arab RepublicSYR | 10.8% | 2010 | |
| LibyaLBY | 10.2% | 2014 | |
| Equatorial GuineaGNQ | 10.1% | 2011 | |
| BotswanaBWA | 9.4% | 2007 | |
| Sri LankaLKA | 9.3% | 2024 | |
| TajikistanTJK | 9.3% | 2017 | |
| MaldivesMDV | 9.2% | 2017 | |
| SerbiaSRB | 9.1% | 2019 | |
| ArmeniaARM | 8.9% | 2010 | |
| BeninBEN | 8.8% | 2021 | |
| OmanOMN | 8.7% | 2017 | |
| Congo, Dem. Rep.COD | 8.6% | 2017 | |
| Burkina FasoBFA | 8.4% | 2021 | |
| EthiopiaETH | 8.3% | 2019 | |
| TurkiyeTUR | 8.3% | 2013 | |
| Kyrgyz RepublicKGZ | 8.2% | 2023 | |
| BurundiBDI | 7.8% | 2024 | |
| Solomon IslandsSLB | 7.8% | 2015 | |
| FijiFJI | 7.7% | 2021 | |
| IndonesiaIDN | 7.7% | 2023 | |
| ThailandTHA | 7.5% | 2022 | |
| AlbaniaALB | 7.3% | 2009 | |
| NigerNER | 7.1% | 2022 | |
| Cabo VerdeCPV | 6.9% | 1994 |
Source: World Health Organization (WHO GHO)