Under-Five Mortality
DemographicsUN DESAun_desa_pop:Q5•per 1,000 live births•1950 → 2026•225 countries
Series quick facts
High-level context for this country series.
DemographicsUN DESA
Coverage
225
Frequency
yearly
Range
1950 \u2192 2026
Latest
2026
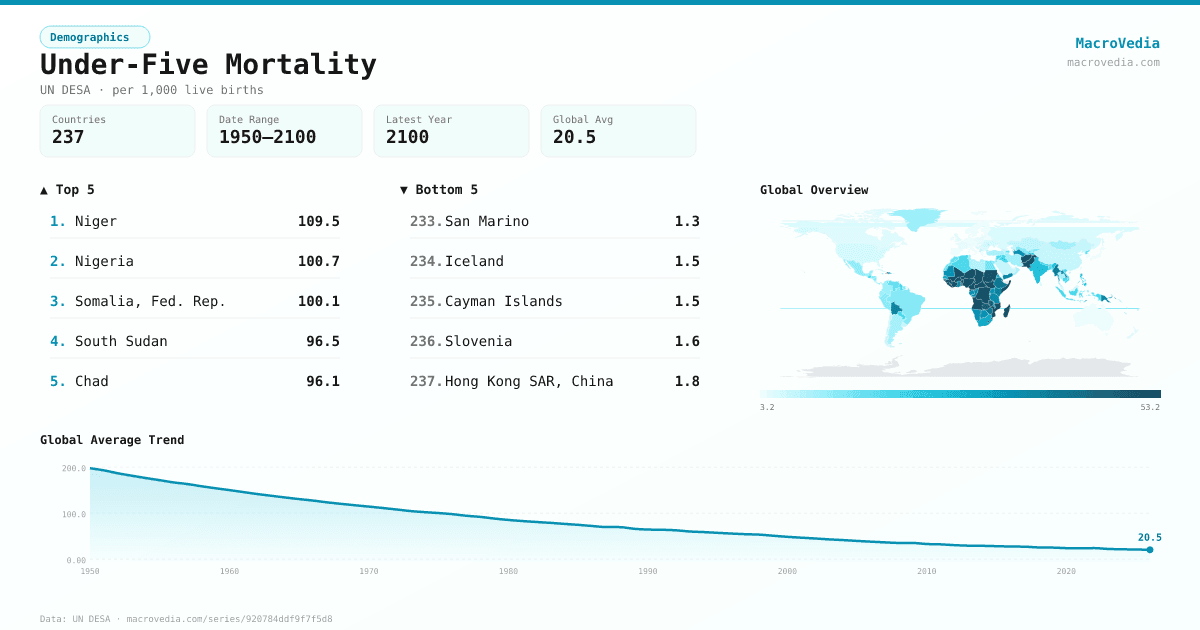
Under-Five Mortality by country
Latest available value per country (as of 2026)
Low \u2192 High
Unit: per 1,000 live births
≤ 3.5
3.5 – 5.91
5.91 – 9.93
9.93 – 13.57
13.57 – 21.79
21.79 – 42.11
> 42.11
No data
Generated by MacroVedia.comSource: UN Department of Economic and Social Affairs (UN DESA)
Highest 15 countries
Under-Five Mortality
50 countries with data
Generated by MacroVedia.comSource: UN Department of Economic and Social Affairs (UN DESA)
Distribution across countries
Under-Five Mortality
Countries
50
Median
51.7
Mean
58
25th pctl
39
75th pctl
68.2
Generated by MacroVedia.comSource: UN Department of Economic and Social Affairs (UN DESA)
Compare trends
Under-Five Mortality
NigerNigeriaSomalia, Fed. Rep.
Generated by MacroVedia.comSource: UN Department of Economic and Social Affairs (UN DESA)
| Country | Latest | Date | Trend |
|---|---|---|---|
| NigerNER | 109.49 per 1,000 live births | 2026 | |
| NigeriaNGA | 100.74 per 1,000 live births | 2026 | |
| Somalia, Fed. Rep.SOM | 100.06 per 1,000 live births | 2026 | |
| South SudanSSD | 96.53 per 1,000 live births | 2026 | |
| ChadTCD | 96.12 per 1,000 live births | 2026 | |
| Sierra LeoneSLE | 92.6 per 1,000 live births | 2026 | |
| GuineaGIN | 89.87 per 1,000 live births | 2026 | |
| Central African RepublicCAF | 89.68 per 1,000 live births | 2026 | |
| MaliMLI | 89.08 per 1,000 live births | 2026 | |
| Burkina FasoBFA | 79.2 per 1,000 live births | 2026 | |
| BeninBEN | 75.56 per 1,000 live births | 2026 | |
| Congo, Dem. Rep.COD | 70.59 per 1,000 live births | 2026 | |
| LiberiaLBR | 68.23 per 1,000 live births | 2026 | |
| Equatorial GuineaGNQ | 66.49 per 1,000 live births | 2026 | |
| Guinea-BissauGNB | 66.06 per 1,000 live births | 2026 | |
| LesothoLSO | 65.18 per 1,000 live births | 2026 | |
| Cote d'IvoireCIV | 64.47 per 1,000 live births | 2026 | |
| CameroonCMR | 62.29 per 1,000 live births | 2026 | |
| MadagascarMDG | 61.96 per 1,000 live births | 2026 | |
| AngolaAGO | 60.75 per 1,000 live births | 2026 | |
| MozambiqueMOZ | 60.73 per 1,000 live births | 2026 | |
| PakistanPAK | 55.88 per 1,000 live births | 2026 | |
| TogoTGO | 55.44 per 1,000 live births | 2026 | |
| HaitiHTI | 54.71 per 1,000 live births | 2026 | |
| KiribatiKIR | 52.26 per 1,000 live births | 2026 | |
| AfghanistanAFG | 51.17 per 1,000 live births | 2026 | |
| SudanSDN | 51.03 per 1,000 live births | 2026 | |
| ZambiaZMB | 48.67 per 1,000 live births | 2026 | |
| EswatiniSWZ | 47.52 per 1,000 live births | 2026 | |
| DjiboutiDJI | 47.1 per 1,000 live births | 2026 | |
| BurundiBDI | 46.82 per 1,000 live births | 2026 | |
| Timor-LesteTLS | 42.22 per 1,000 live births | 2026 | |
| ZimbabweZWE | 42.11 per 1,000 live births | 2026 | |
| ComorosCOM | 41.75 per 1,000 live births | 2026 | |
| Gambia, TheGMB | 41.5 per 1,000 live births | 2026 | |
| EthiopiaETH | 40.53 per 1,000 live births | 2026 | |
| MyanmarMMR | 39.33 per 1,000 live births | 2026 | |
| KenyaKEN | 39.02 per 1,000 live births | 2026 | |
| GhanaGHA | 38.75 per 1,000 live births | 2026 | |
| BoliviaBOL | 38.49 per 1,000 live births | 2026 | |
| Papua New GuineaPNG | 38.07 per 1,000 live births | 2026 | |
| Congo, Rep.COG | 36.94 per 1,000 live births | 2026 | |
| Yemen, Rep.YEM | 36.89 per 1,000 live births | 2026 | |
| MalawiMWI | 36.7 per 1,000 live births | 2026 | |
| TanzaniaTZA | 36.28 per 1,000 live births | 2026 | |
| UgandaUGA | 35.34 per 1,000 live births | 2026 | |
| BotswanaBWA | 35.17 per 1,000 live births | 2026 | |
| NamibiaNAM | 35.1 per 1,000 live births | 2026 | |
| GabonGAB | 34.42 per 1,000 live births | 2026 | |
| Lao PDRLAO | 34.21 per 1,000 live births | 2026 |
Source: UN Department of Economic and Social Affairs (UN DESA)