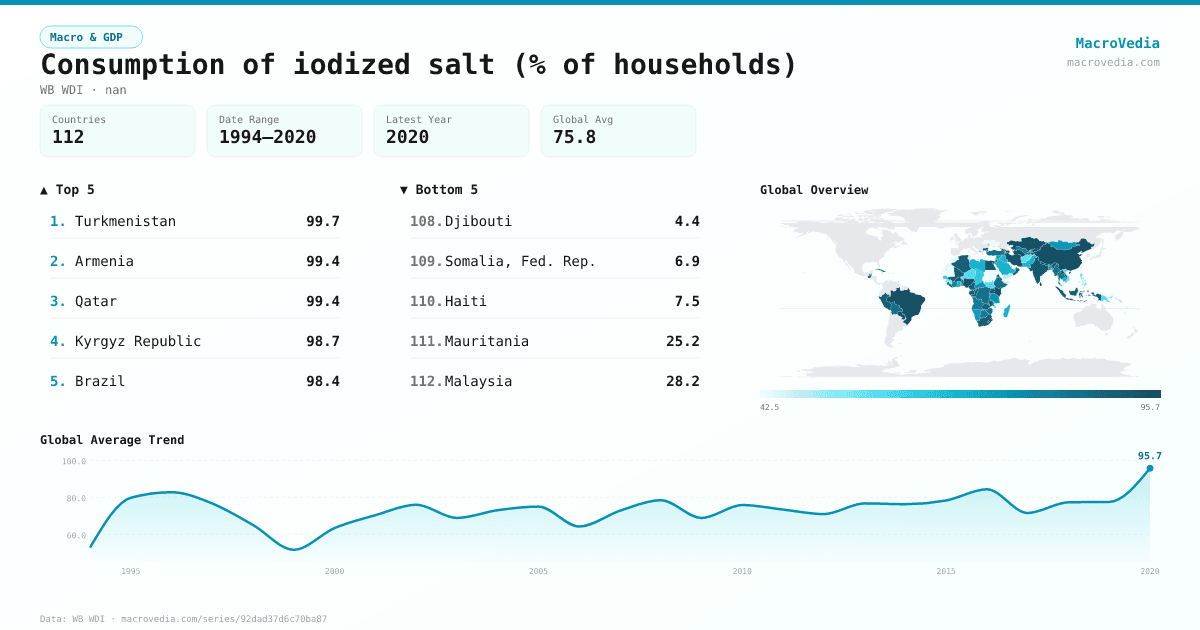
Consumption of iodized salt (% of households)
Macro & GDPWB WDIwb_wdi:SN.ITK.SALT.ZS•nan•1994 → 2020•112 countries
Series quick facts
High-level context for this country series.
Macro & GDPWB WDI
Coverage
112
Frequency
—
Range
1994 \u2192 2020
Latest
2020
Consumption of iodized salt (% of households) by country
Latest available value per country (as of 2020)
Low \u2192 High
Unit: %
≤ 56.03%
56.03% – 68.54%
68.54% – 81.07%
81.07% – 85.91%
85.91% – 90.89%
90.89% – 93.69%
> 93.69%
No data
Generated by MacroVedia.comSource: World Bank (WB WDI)
Highest 15 countries
Consumption of iodized salt (% of households)
50 countries with data
Generated by MacroVedia.comSource: World Bank (WB WDI)
Distribution across countries
Consumption of iodized salt (% of households)
Countries
50
Median
91.9%
Mean
92.5%
25th pctl
89.5%
75th pctl
95.3%
Generated by MacroVedia.comSource: World Bank (WB WDI)
Compare trends
Consumption of iodized salt (% of households)
PeruTajikistanCameroon
Generated by MacroVedia.comSource: World Bank (WB WDI)
| Country | Latest | Date | Trend |
|---|---|---|---|
| TurkmenistanTKM | 99.7% | 2015 | |
| ArmeniaARM | 99.4% | 2016 | |
| QatarQAT | 99.4% | 2012 | — |
| Kyrgyz RepublicKGZ | 98.7% | 2018 | |
| BrazilBRA | 98.4% | 2007 | |
| BhutanBTN | 98.4% | 2008 | — |
| GeorgiaGEO | 98.1% | 2009 | |
| Sri LankaLKA | 96.9% | 2016 | |
| MaldivesMDV | 96.7% | 2008 | — |
| ChinaCHN | 96.6% | 2018 | |
| SamoaWSM | 96.4% | 2014 | — |
| West Bank and GazaPSE | 95.7% | 2020 | |
| LebanonLBN | 95.3% | 2004 | — |
| KenyaKEN | 94.6% | 2014 | |
| KazakhstanKAZ | 94.4% | 2015 | |
| NepalNPL | 94.2% | 2017 | |
| Lao PDRLAO | 93.6% | 2017 | |
| Iran, Islamic Rep.IRN | 93.5% | 2000 | |
| AzerbaijanAZE | 93.4% | 2013 | |
| ParaguayPRY | 93.4% | 2011 | |
| NigeriaNGA | 93.3% | 2018 | |
| Egypt, Arab Rep.EGY | 92.5% | 2015 | |
| IndiaIND | 92.4% | 2018 | |
| Burkina FasoBFA | 92.1% | 2010 | |
| BulgariaBGR | 91.9% | 2012 | — |
| Cabo VerdeCPV | 91.9% | 2010 | |
| IndonesiaIDN | 91.9% | 2013 | — |
| TajikistanTJK | 91.4% | 2017 | |
| UgandaUGA | 91.3% | 2016 | |
| Congo, Rep.COG | 91.1% | 2014 | |
| LiberiaLBR | 91.1% | 2013 | |
| South AfricaZAF | 91.1% | 2016 | — |
| PeruPER | 90.8% | 2019 | |
| CameroonCMR | 90.7% | 2018 | |
| RwandaRWA | 90.5% | 2015 | |
| EswatiniSWZ | 90.4% | 2014 | |
| CubaCUB | 89.9% | 2019 | — |
| GabonGAB | 89.5% | 2012 | |
| BurundiBDI | 89.4% | 2016 | |
| MaliMLI | 89.4% | 2018 | |
| AlgeriaDZA | 89.1% | 2019 | |
| Sao Tome and PrincipeSTP | 88.6% | 2019 | |
| Solomon IslandsSLB | 88.4% | 2015 | — |
| ZambiaZMB | 88.4% | 2013 | |
| JordanJOR | 88.3% | 2000 | — |
| GuatemalaGTM | 88.2% | 2009 | |
| OmanOMN | 87.7% | 2014 | — |
| EritreaERI | 86.2% | 2010 | |
| BoliviaBOL | 85.7% | 2016 | |
| EthiopiaETH | 85.6% | 2016 |
Source: World Bank (WB WDI)