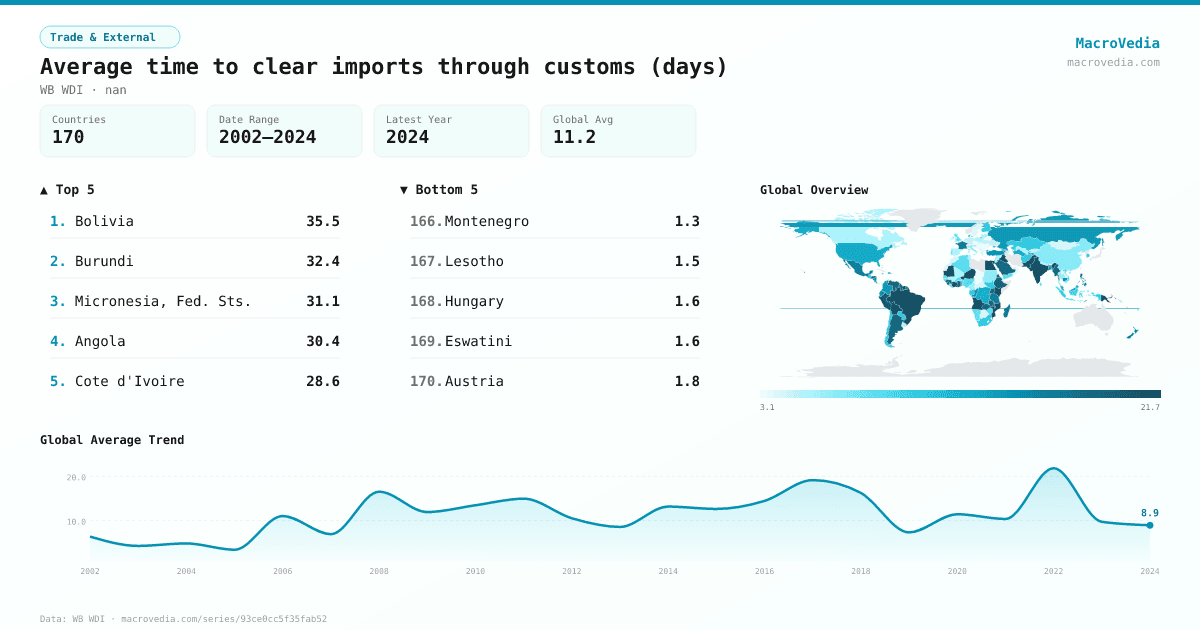
Average time to clear imports through customs (days)
Trade & ExternalWB WDIwb_wdi:IC.CUS.DURS.IM•nan•2002 → 2024•170 countries
Series quick facts
High-level context for this country series.
Trade & ExternalWB WDI
Coverage
170
Frequency
—
Range
2002 \u2192 2024
Latest
2024
Average time to clear imports through customs (days) by country
Latest available value per country (as of 2024)
Low \u2192 High
Unit: nan
≤ 4.59K
4.59K – 6.29K
6.29K – 9.58K
9.58K – 13.44K
13.44K – 18.04K
18.04K – 21.57K
> 21.57K
No data
Generated by MacroVedia.comSource: World Bank (WB WDI)
Highest 15 countries
Average time to clear imports through customs (days)
50 countries with data
Generated by MacroVedia.comSource: World Bank (WB WDI)
Distribution across countries
Average time to clear imports through customs (days)
Countries
50
Median
21.5K
Mean
23.4K
25th pctl
19.1K
75th pctl
27.8K
Generated by MacroVedia.comSource: World Bank (WB WDI)
Compare trends
Average time to clear imports through customs (days)
ArmeniaEl SalvadorMali
Generated by MacroVedia.comSource: World Bank (WB WDI)
| Country | Latest | Date | Trend |
|---|---|---|---|
| BoliviaBOL | 35.46K nan | 2017 | |
| BurundiBDI | 32.39K nan | 2014 | |
| MaliMLI | 31.52K nan | 2016 | |
| Congo, Rep.COG | 31.43K nan | 2009 | — |
| Micronesia, Fed. Sts.FSM | 31.06K nan | 2009 | — |
| ChadTCD | 30.76K nan | 2018 | |
| AngolaAGO | 30.39K nan | 2024 | |
| TanzaniaTZA | 29.55K nan | 2013 | |
| Congo, Dem. Rep.COD | 28.76K nan | 2013 | |
| Cote d'IvoireCIV | 28.58K nan | 2023 | |
| NigerNER | 28.25K nan | 2017 | |
| IraqIRQ | 27.84K nan | 2022 | |
| VanuatuVUT | 27.82K nan | 2023 | |
| MauritaniaMRT | 26.72K nan | 2014 | |
| IndiaIND | 26.56K nan | 2022 | |
| PakistanPAK | 25.81K nan | 2022 | |
| Papua New GuineaPNG | 25.54K nan | 2024 | |
| ParaguayPRY | 25.19K nan | 2017 | |
| BrazilBRA | 24.68K nan | 2009 | |
| Egypt, Arab Rep.EGY | 23.89K nan | 2020 | |
| SurinameSUR | 23.49K nan | 2018 | — |
| CameroonCMR | 23.39K nan | 2016 | |
| ArmeniaARM | 22.75K nan | 2024 | |
| KenyaKEN | 22.52K nan | 2018 | |
| MozambiqueMOZ | 21.58K nan | 2018 | |
| Yemen, Rep.YEM | 21.52K nan | 2010 | — |
| Gambia, TheGMB | 21.39K nan | 2018 | |
| Timor-LesteTLS | 21.08K nan | 2021 | |
| Cabo VerdeCPV | 20.51K nan | 2009 | |
| PeruPER | 20.15K nan | 2023 | |
| EritreaERI | 20.12K nan | 2009 | |
| MalawiMWI | 20.01K nan | 2014 | |
| GhanaGHA | 19.84K nan | 2023 | |
| EthiopiaETH | 19.49K nan | 2015 | |
| UgandaUGA | 19.44K nan | 2013 | |
| ZambiaZMB | 19.35K nan | 2019 | |
| GuyanaGUY | 19.22K nan | 2010 | |
| MyanmarMMR | 19.09K nan | 2016 | |
| JamaicaJAM | 19.03K nan | 2024 | |
| Venezuela, RBVEN | 18.91K nan | 2010 | — |
| HondurasHND | 18.68K nan | 2016 | |
| TogoTGO | 18.65K nan | 2023 | |
| ArgentinaARG | 18.63K nan | 2017 | |
| KazakhstanKAZ | 18.54K nan | 2019 | |
| Saudi ArabiaSAU | 18.33K nan | 2022 | — |
| Sierra LeoneSLE | 18.23K nan | 2023 | |
| PhilippinesPHL | 18.21K nan | 2023 | |
| El SalvadorSLV | 18.14K nan | 2023 | |
| GuineaGIN | 18.09K nan | 2016 | |
| SenegalSEN | 17.93K nan | 2014 |
Source: World Bank (WB WDI)