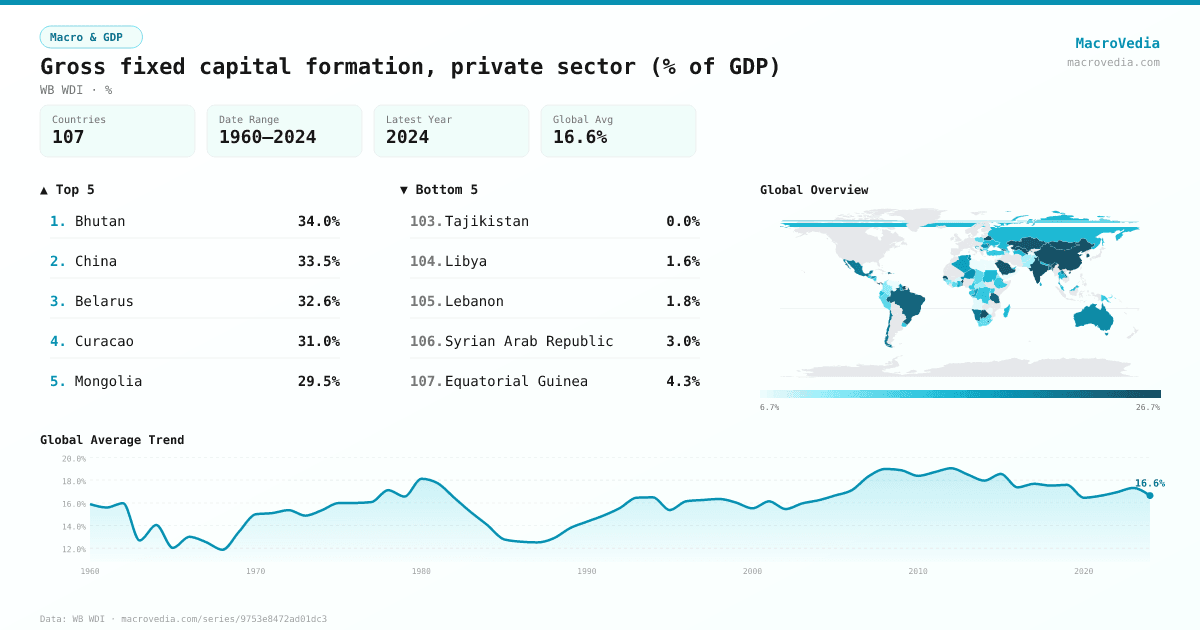
Gross fixed capital formation, private sector (% of GDP)
Macro & GDPWB WDIwb_wdi:NE.GDI.FPRV.ZS•%•1960 → 2024•107 countries
Series quick facts
High-level context for this country series.
Macro & GDPWB WDI
Coverage
107
Frequency
—
Range
1960 \u2192 2024
Latest
2024
Gross fixed capital formation, private sector (% of GDP) by country
Latest available value per country (as of 2024)
Low \u2192 High
Unit: %
≤ 8.81%
8.81% – 12.44%
12.44% – 15.28%
15.28% – 17.6%
17.6% – 20.88%
20.88% – 25.63%
> 25.63%
No data
Generated by MacroVedia.comSource: World Bank (WB WDI)
Highest 15 countries
Gross fixed capital formation, private sector (% of GDP)
50 countries with data
Generated by MacroVedia.comSource: World Bank (WB WDI)
Distribution across countries
Gross fixed capital formation, private sector (% of GDP)
Countries
50
Median
22.2%
Mean
23.8%
25th pctl
19.4%
75th pctl
26.6%
Generated by MacroVedia.comSource: World Bank (WB WDI)
Compare trends
Gross fixed capital formation, private sector (% of GDP)
HondurasAustraliaSingapore
Generated by MacroVedia.comSource: World Bank (WB WDI)
| Country | Latest | Date | Trend |
|---|---|---|---|
| SurinameSUR | 53.97% | 2009 | |
| BhutanBTN | 33.98% | 2023 | |
| ChinaCHN | 33.48% | 2023 | |
| BelarusBLR | 32.64% | 2013 | |
| CuracaoCUW | 31.01% | 2018 | |
| MongoliaMNG | 29.54% | 2007 | |
| GuamGUM | 29.13% | 2022 | |
| BeninBEN | 28.12% | 2024 | |
| BotswanaBWA | 27.54% | 2013 | |
| SenegalSEN | 27.39% | 2024 | |
| Brunei DarussalamBRN | 26.69% | 2024 | |
| UzbekistanUZB | 26.65% | 2009 | |
| BahrainBHR | 26.59% | 2024 | |
| IndiaIND | 26.41% | 2023 | |
| KazakhstanKAZ | 25.67% | 2006 | |
| Dominican RepublicDOM | 25.65% | 2023 | |
| Saudi ArabiaSAU | 25.52% | 2024 | |
| Korea, Rep.KOR | 25.44% | 2024 | |
| PanamaPAN | 25.41% | 2024 | |
| KosovoXKX | 24.53% | 2024 | |
| TanzaniaTZA | 24.04% | 2024 | |
| BangladeshBGD | 23.96% | 2024 | |
| BrazilBRA | 23.73% | 1989 | |
| GeorgiaGEO | 22.89% | 2002 | |
| MoldovaMDA | 22.6% | 2005 | |
| ChileCHL | 21.83% | 2024 | |
| NamibiaNAM | 21.73% | 2024 | |
| AzerbaijanAZE | 21.52% | 2006 | |
| MexicoMEX | 21.25% | 2024 | |
| Lao PDRLAO | 21.15% | 2016 | |
| LesothoLSO | 21.13% | 1981 | |
| HondurasHND | 20.25% | 2024 | |
| TunisiaTUN | 20.18% | 2007 | |
| AustraliaAUS | 20.06% | 2024 | |
| CroatiaHRV | 19.97% | 2024 | |
| RomaniaROU | 19.42% | 2024 | |
| El SalvadorSLV | 19.38% | 2024 | |
| Gambia, TheGMB | 19.37% | 2024 | |
| NigerNER | 19.28% | 2024 | |
| DjiboutiDJI | 19.18% | 2024 | |
| North MacedoniaMKD | 19.11% | 2024 | |
| GuyanaGUY | 19.03% | 2005 | |
| Guinea-BissauGNB | 18.3% | 2024 | |
| AlgeriaDZA | 18.26% | 1998 | |
| TogoTGO | 18.12% | 2022 | |
| Congo, Rep.COG | 17.71% | 2020 | |
| SingaporeSGP | 17.46% | 2024 | |
| Sri LankaLKA | 17.34% | 2009 | |
| MauritiusMUS | 17.22% | 2024 | |
| GhanaGHA | 17% | 2005 |
Source: World Bank (WB WDI)