Community health workers (per 1,000 people)
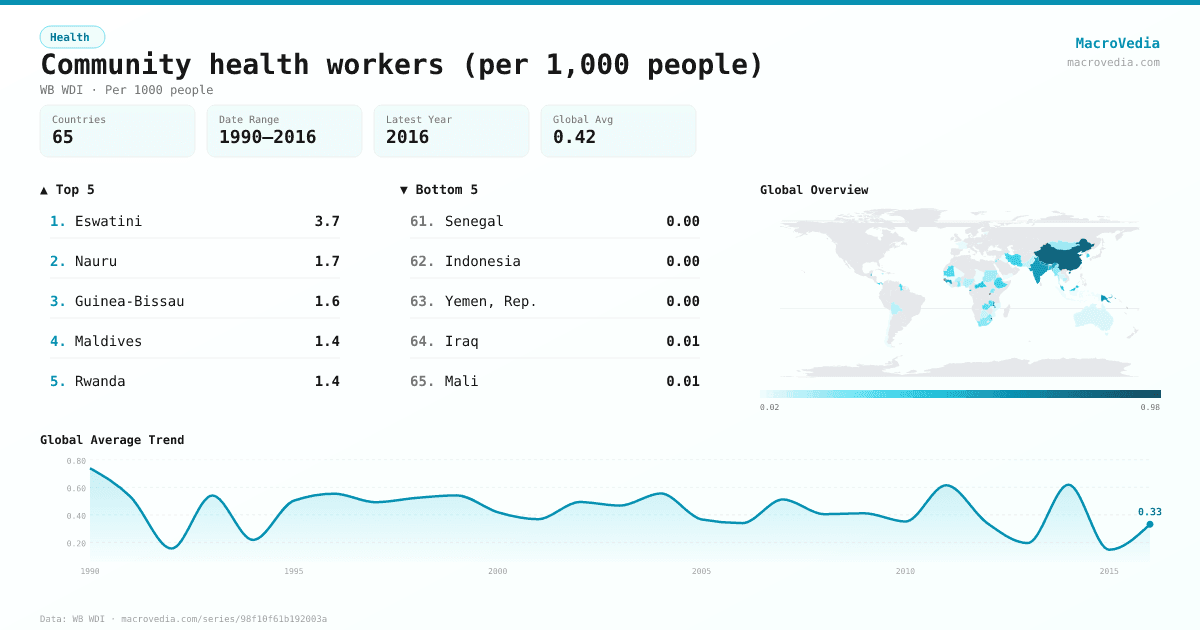
HealthWB WDIwb_wdi:SH.MED.CMHW.P3•Per 1000 people•1990 → 2016•65 countries
Series quick facts
High-level context for this country series.
HealthWB WDI
Coverage
65
Frequency
—
Range
1990 \u2192 2016
Latest
2016
Community health workers (per 1,000 people) by country
Latest available value per country (as of 2016)
Low \u2192 High
Unit: Per 1000 people
≤ 0.03
0.03 – 0.13
0.13 – 0.19
0.19 – 0.35
0.35 – 0.5
0.5 – 0.72
> 0.72
No data
Generated by MacroVedia.comSource: World Bank (WB WDI)
Highest 15 countries
Community health workers (per 1,000 people)
50 countries with data
Generated by MacroVedia.comSource: World Bank (WB WDI)
Distribution across countries
Community health workers (per 1,000 people)
Countries
50
Median
0.4
Mean
0.5
25th pctl
0.2
75th pctl
0.6
Generated by MacroVedia.comSource: World Bank (WB WDI)
Compare trends
Community health workers (per 1,000 people)
ChinaPakistanSt. Kitts and Nevis
Generated by MacroVedia.comSource: World Bank (WB WDI)
| Country | Latest | Date | Trend |
|---|---|---|---|
| EswatiniSWZ | 3.65 Per 1000 people | 2004 | — |
| NauruNRU | 1.69 Per 1000 people | 2011 | |
| Guinea-BissauGNB | 1.65 Per 1000 people | 2004 | — |
| MaldivesMDV | 1.42 Per 1000 people | 2014 | |
| RwandaRWA | 1.36 Per 1000 people | 2004 | — |
| St. Kitts and NevisKNA | 1.04 Per 1000 people | 2001 | |
| Sao Tome and PrincipeSTP | 1 Per 1000 people | 2004 | — |
| VanuatuVUT | 0.94 Per 1000 people | 2008 | |
| ChinaCHN | 0.83 Per 1000 people | 2011 | |
| Gambia, TheGMB | 0.73 Per 1000 people | 2008 | |
| MalawiMWI | 0.72 Per 1000 people | 2008 | — |
| NepalNPL | 0.68 Per 1000 people | 2004 | — |
| Papua New GuineaPNG | 0.59 Per 1000 people | 2008 | — |
| IndiaIND | 0.58 Per 1000 people | 2016 | |
| GhanaGHA | 0.56 Per 1000 people | 2003 | |
| GuineaGIN | 0.52 Per 1000 people | 2016 | — |
| Equatorial GuineaGNQ | 0.51 Per 1000 people | 2004 | — |
| BelizeBLZ | 0.5 Per 1000 people | 2009 | — |
| SingaporeSGP | 0.5 Per 1000 people | 2016 | |
| BangladeshBGD | 0.48 Per 1000 people | 2012 | |
| PanamaPAN | 0.46 Per 1000 people | 2000 | — |
| GrenadaGRD | 0.44 Per 1000 people | 2003 | |
| MalaysiaMYS | 0.44 Per 1000 people | 2010 | — |
| St. Vincent and the GrenadinesVCT | 0.42 Per 1000 people | 2000 | — |
| Central African RepublicCAF | 0.39 Per 1000 people | 2009 | |
| Korea, Rep.KOR | 0.38 Per 1000 people | 2009 | |
| Iran, Islamic Rep.IRN | 0.36 Per 1000 people | 2004 | — |
| EthiopiaETH | 0.36 Per 1000 people | 2009 | |
| GuyanaGUY | 0.33 Per 1000 people | 2010 | |
| JamaicaJAM | 0.32 Per 1000 people | 2016 | |
| MauritaniaMRT | 0.3 Per 1000 people | 2013 | — |
| Micronesia, Fed. Sts.FSM | 0.3 Per 1000 people | 2008 | — |
| ZambiaZMB | 0.29 Per 1000 people | 2008 | |
| BotswanaBWA | 0.23 Per 1000 people | 2008 | |
| AustraliaAUS | 0.2 Per 1000 people | 2001 | |
| MyanmarMMR | 0.2 Per 1000 people | 2012 | |
| MauritiusMUS | 0.19 Per 1000 people | 2004 | — |
| UgandaUGA | 0.19 Per 1000 people | 2005 | — |
| JordanJOR | 0.19 Per 1000 people | 2004 | — |
| South AfricaZAF | 0.19 Per 1000 people | 2004 | — |
| BhutanBTN | 0.19 Per 1000 people | 2015 | |
| MongoliaMNG | 0.16 Per 1000 people | 2010 | |
| SudanSDN | 0.15 Per 1000 people | 2004 | — |
| Cabo VerdeCPV | 0.14 Per 1000 people | 2004 | — |
| NigeriaNGA | 0.13 Per 1000 people | 2008 | |
| Yemen, Rep.YEM | 0.13 Per 1000 people | 2004 | — |
| Burkina FasoBFA | 0.13 Per 1000 people | 2012 | |
| CambodiaKHM | 0.13 Per 1000 people | 2004 | — |
| BoliviaBOL | 0.12 Per 1000 people | 2001 | — |
| PakistanPAK | 0.09 Per 1000 people | 2015 |
Source: World Bank (WB WDI)