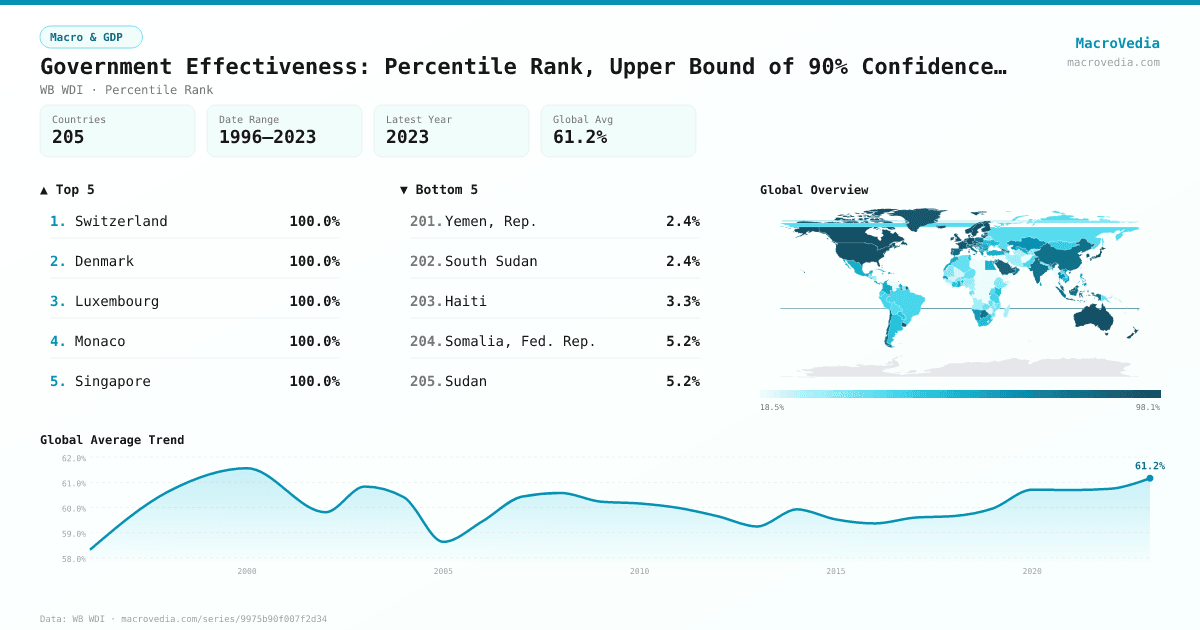
Government Effectiveness: Percentile Rank, Upper Bound of 90% Confidence Interval
Macro & GDPWB WDIwb_wdi:GE.PER.RNK.UPPER•Percentile Rank•1996 → 2023•205 countries
Series quick facts
High-level context for this country series.
Macro & GDPWB WDI
Coverage
205
Frequency
yearly
Range
1996 \u2192 2023
Latest
2023
Government Effectiveness: Percentile Rank, Upper Bound of 90% Confidence Interval by country
Latest available value per country (as of 2023)
Low \u2192 High
Unit: %
≤ 29.25%
29.25% – 40.63%
40.63% – 58.49%
58.49% – 69.61%
69.61% – 82.08%
82.08% – 95.28%
> 95.28%
No data
Generated by MacroVedia.comSource: World Bank (WB WDI)
Highest 15 countries
Government Effectiveness: Percentile Rank, Upper Bound of 90% Confidence Interval
50 countries with data
Generated by MacroVedia.comSource: World Bank (WB WDI)
Distribution across countries
Government Effectiveness: Percentile Rank, Upper Bound of 90% Confidence Interval
Countries
50
Median
96.9%
Mean
95.4%
25th pctl
91.5%
75th pctl
99.1%
Generated by MacroVedia.comSource: World Bank (WB WDI)
Compare trends
Government Effectiveness: Percentile Rank, Upper Bound of 90% Confidence Interval
SwitzerlandDenmarkLuxembourg
Generated by MacroVedia.comSource: World Bank (WB WDI)
| Country | Latest | Date | Trend |
|---|---|---|---|
| SwitzerlandCHE | 100% | 2023 | |
| DenmarkDNK | 100% | 2023 | |
| LuxembourgLUX | 100% | 2023 | |
| MonacoMCO | 100% | 2023 | |
| SingaporeSGP | 100% | 2023 | |
| AndorraAND | 99.53% | 2023 | |
| FinlandFIN | 99.53% | 2023 | |
| LiechtensteinLIE | 99.53% | 2023 | |
| NorwayNOR | 99.53% | 2023 | |
| United Arab EmiratesARE | 99.06% | 2023 | |
| AustraliaAUS | 99.06% | 2023 | |
| BermudaBMU | 99.06% | 2023 | |
| IrelandIRL | 99.06% | 2023 | |
| JapanJPN | 99.06% | 2023 | |
| NetherlandsNLD | 99.06% | 2023 | |
| San MarinoSMR | 99.06% | 2023 | |
| SwedenSWE | 99.06% | 2023 | |
| Brunei DarussalamBRN | 98.11% | 2023 | |
| CanadaCAN | 98.11% | 2023 | |
| Hong Kong SAR, ChinaHKG | 98.11% | 2023 | |
| IcelandISL | 98.11% | 2023 | |
| New ZealandNZL | 98.11% | 2023 | |
| Cayman IslandsCYM | 97.64% | 2023 | |
| Korea, Rep.KOR | 97.64% | 2023 | |
| AustriaAUT | 97.17% | 2023 | |
| EstoniaEST | 96.7% | 2023 | |
| Macao SAR, ChinaMAC | 96.7% | 2023 | |
| United StatesUSA | 96.7% | 2023 | |
| QatarQAT | 95.75% | 2023 | |
| GermanyDEU | 95.28% | 2023 | |
| United KingdomGBR | 95.28% | 2023 | |
| IsraelISR | 94.34% | 2023 | |
| FranceFRA | 93.4% | 2023 | |
| GreenlandGRL | 93.4% | 2023 | |
| CzechiaCZE | 91.98% | 2023 | |
| American SamoaASM | 91.51% | 2023 | |
| GuamGUM | 91.51% | 2023 | |
| Virgin Islands (U.S.)VIR | 91.51% | 2023 | |
| ArubaABW | 90.57% | 2023 | |
| BelgiumBEL | 90.57% | 2023 | |
| LithuaniaLTU | 90.57% | 2023 | |
| PortugalPRT | 90.57% | 2023 | |
| SloveniaSVN | 90.57% | 2023 | |
| MalaysiaMYS | 89.15% | 2023 | |
| GeorgiaGEO | 88.68% | 2023 | |
| UruguayURY | 88.68% | 2023 | |
| PalauPLW | 88.21% | 2023 | |
| Antigua and BarbudaATG | 87.74% | 2023 | |
| St. Kitts and NevisKNA | 87.74% | 2023 | |
| Saudi ArabiaSAU | 87.26% | 2023 |
Source: World Bank (WB WDI)