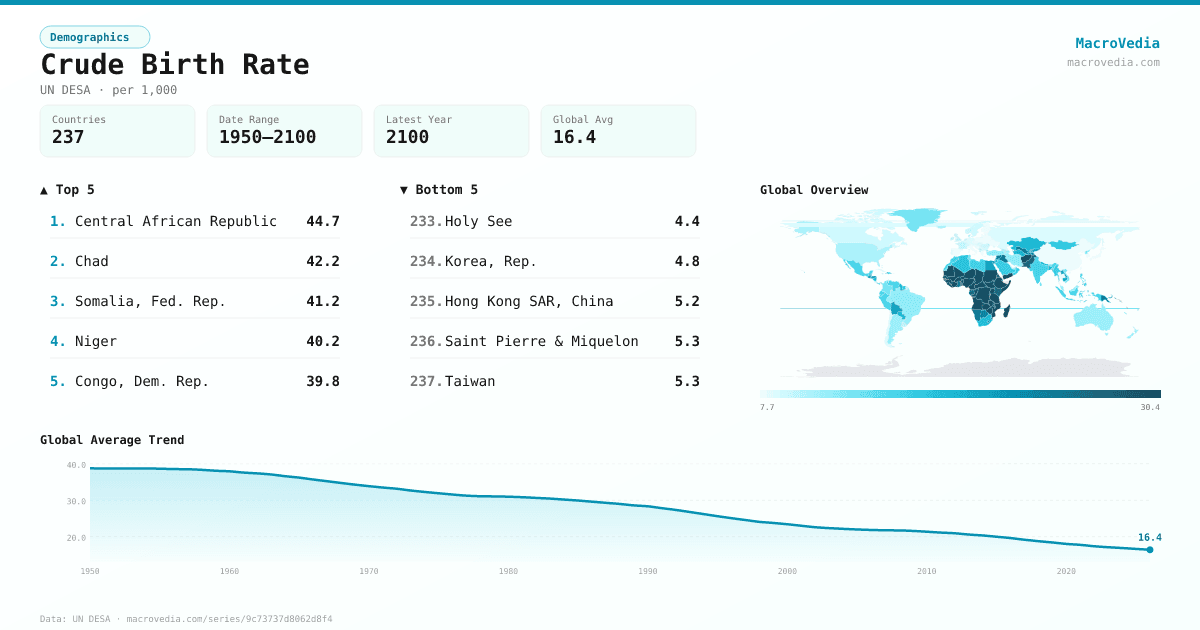
Crude Birth Rate
DemographicsUN DESAun_desa_pop:CBR•per 1,000•1950 → 2026•225 countries
Series quick facts
High-level context for this country series.
DemographicsUN DESA
Coverage
225
Frequency
yearly
Range
1950 \u2192 2026
Latest
2026
Crude Birth Rate by country
Latest available value per country (as of 2026)
Low \u2192 High
Unit: per 1,000
≤ 8.2
8.2 – 9.72
9.72 – 11.5
11.5 – 15.71
15.71 – 20.51
20.51 – 28.74
> 28.74
No data
Generated by MacroVedia.comSource: UN Department of Economic and Social Affairs (UN DESA)
Highest 15 countries
Crude Birth Rate
50 countries with data
Generated by MacroVedia.comSource: UN Department of Economic and Social Affairs (UN DESA)
Distribution across countries
Crude Birth Rate
Countries
50
Median
30.2
Mean
31
25th pctl
27.5
75th pctl
32.7
Generated by MacroVedia.comSource: UN Department of Economic and Social Affairs (UN DESA)
Compare trends
Crude Birth Rate
Central African RepublicChadSomalia, Fed. Rep.
Generated by MacroVedia.comSource: UN Department of Economic and Social Affairs (UN DESA)
| Country | Latest | Date | Trend |
|---|---|---|---|
| Central African RepublicCAF | 44.71 per 1,000 | 2026 | |
| ChadTCD | 42.2 per 1,000 | 2026 | |
| Somalia, Fed. Rep.SOM | 41.19 per 1,000 | 2026 | |
| NigerNER | 40.15 per 1,000 | 2026 | |
| Congo, Dem. Rep.COD | 39.8 per 1,000 | 2026 | |
| MaliMLI | 38.77 per 1,000 | 2026 | |
| AngolaAGO | 36.33 per 1,000 | 2026 | |
| MozambiqueMOZ | 36.13 per 1,000 | 2026 | |
| TanzaniaTZA | 33.9 per 1,000 | 2026 | |
| AfghanistanAFG | 33.76 per 1,000 | 2026 | |
| MauritaniaMRT | 33.2 per 1,000 | 2026 | |
| UgandaUGA | 33.11 per 1,000 | 2026 | |
| Yemen, Rep.YEM | 32.75 per 1,000 | 2026 | |
| BeninBEN | 32.58 per 1,000 | 2026 | |
| CameroonCMR | 32.36 per 1,000 | 2026 | |
| GuineaGIN | 32.21 per 1,000 | 2026 | |
| BurundiBDI | 32.02 per 1,000 | 2026 | |
| ZambiaZMB | 32.02 per 1,000 | 2026 | |
| NigeriaNGA | 31.81 per 1,000 | 2026 | |
| SudanSDN | 31.79 per 1,000 | 2026 | |
| MadagascarMDG | 30.84 per 1,000 | 2026 | |
| Cote d'IvoireCIV | 30.72 per 1,000 | 2026 | |
| Burkina FasoBFA | 30.4 per 1,000 | 2026 | |
| MalawiMWI | 30.38 per 1,000 | 2026 | |
| EthiopiaETH | 30.33 per 1,000 | 2026 | |
| TogoTGO | 30.15 per 1,000 | 2026 | |
| Congo, Rep.COG | 29.93 per 1,000 | 2026 | |
| LiberiaLBR | 29.89 per 1,000 | 2026 | |
| South SudanSSD | 29.43 per 1,000 | 2026 | |
| ZimbabweZWE | 29.25 per 1,000 | 2026 | |
| Equatorial GuineaGNQ | 29.17 per 1,000 | 2026 | |
| Sierra LeoneSLE | 29.05 per 1,000 | 2026 | |
| Guinea-BissauGNB | 28.74 per 1,000 | 2026 | |
| Gambia, TheGMB | 28.65 per 1,000 | 2026 | |
| SenegalSEN | 28.63 per 1,000 | 2026 | |
| EritreaERI | 28.62 per 1,000 | 2026 | |
| Sao Tome and PrincipeSTP | 27.66 per 1,000 | 2026 | |
| RwandaRWA | 27.49 per 1,000 | 2026 | |
| ComorosCOM | 27.36 per 1,000 | 2026 | |
| VanuatuVUT | 26.84 per 1,000 | 2026 | |
| PakistanPAK | 26.75 per 1,000 | 2026 | |
| KenyaKEN | 26.58 per 1,000 | 2026 | |
| GabonGAB | 26.25 per 1,000 | 2026 | |
| Solomon IslandsSLB | 26.15 per 1,000 | 2026 | |
| West Bank and GazaPSE | 25.38 per 1,000 | 2026 | |
| GhanaGHA | 25.32 per 1,000 | 2026 | |
| NamibiaNAM | 25.03 per 1,000 | 2026 | |
| IraqIRQ | 25 per 1,000 | 2026 | |
| SamoaWSM | 24.36 per 1,000 | 2026 | |
| KiribatiKIR | 24.34 per 1,000 | 2026 |
Source: UN Department of Economic and Social Affairs (UN DESA)