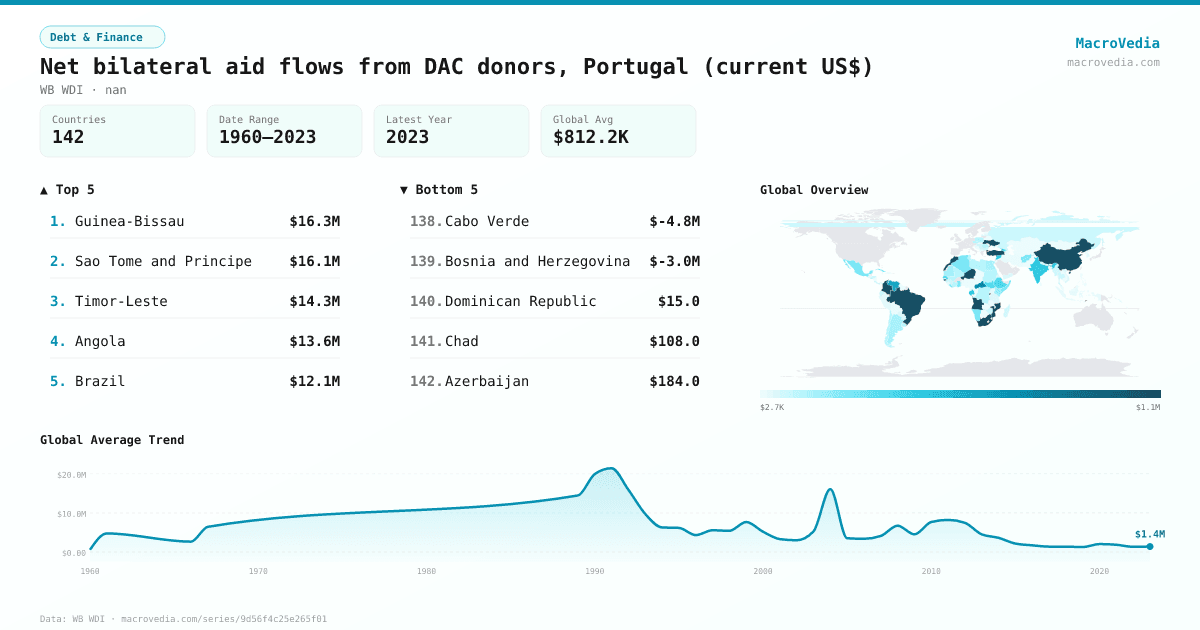
Net bilateral aid flows from DAC donors, Portugal (current US$)
Debt & FinanceWB WDIwb_wdi:DC.DAC.PRTL.CD•nan•1960 → 2023•142 countries
Series quick facts
High-level context for this country series.
Debt & FinanceWB WDI
Coverage
142
Frequency
yearly
Range
1960 \u2192 2023
Latest
2023
Net bilateral aid flows from DAC donors, Portugal (current US$) by country
Latest available value per country (as of 2023)
Low \u2192 High
Unit: US$
≤ 6.53K
6.53K – 20K
20K – 57.33K
57.33K – 99.88K
99.88K – 222.14K
222.14K – 877.51K
> 877.51K
No data
Generated by MacroVedia.comSource: World Bank (WB WDI)
Highest 15 countries
Net bilateral aid flows from DAC donors, Portugal (current US$)
50 countries with data
Generated by MacroVedia.comSource: World Bank (WB WDI)
Distribution across countries
Net bilateral aid flows from DAC donors, Portugal (current US$)
Countries
50
Median
$545.87K
Mean
$3.67M
25th pctl
$243.63K
75th pctl
$3.16M
Generated by MacroVedia.comSource: World Bank (WB WDI)
Compare trends
Net bilateral aid flows from DAC donors, Portugal (current US$)
Guinea-BissauAngolaSao Tome and Principe
Generated by MacroVedia.comSource: World Bank (WB WDI)
| Country | Latest | Date | Trend |
|---|---|---|---|
| UkraineUKR | $32.65M | 2022 | |
| Sao Tome and PrincipeSTP | $32.39M | 2022 | |
| Guinea-BissauGNB | $16.31M | 2023 | |
| Timor-LesteTLS | $14.32M | 2023 | |
| AngolaAGO | $13.61M | 2023 | |
| BrazilBRA | $12.08M | 2023 | |
| MoroccoMAR | $7.98M | 2023 | |
| MozambiqueMOZ | $6.86M | 2022 | |
| West Bank and GazaPSE | $6.52M | 2023 | |
| South SudanSSD | $5.78M | 2022 | |
| Egypt, Arab Rep.EGY | $5.47M | 2022 | |
| RwandaRWA | $3.21M | 2021 | |
| South AfricaZAF | $3.16M | 2023 | |
| NigerNER | $3.02M | 2022 | |
| KosovoXKX | $2.15M | 2022 | |
| El SalvadorSLV | $2.13M | 2022 | |
| TurkiyeTUR | $1.98M | 2023 | |
| ChinaCHN | $1.26M | 2023 | |
| ColombiaCOL | $1.11M | 2023 | |
| ChadTCD | $970K | 2010 | |
| MexicoMEX | $882.78K | 2022 | |
| TunisiaTUN | $845.93K | 2022 | |
| MaliMLI | $738.25K | 2022 | |
| Central African RepublicCAF | $728.58K | 2023 | |
| Venezuela, RBVEN | $603.47K | 2023 | |
| GabonGAB | $488.28K | 2019 | |
| AfghanistanAFG | $488.05K | 2021 | |
| Syrian Arab RepublicSYR | $467.88K | 2023 | |
| GeorgiaGEO | $425.86K | 2023 | |
| IndiaIND | $417.87K | 2023 | |
| MaldivesMDV | $380K | 2006 | |
| SenegalSEN | $378K | 2023 | |
| EthiopiaETH | $356.4K | 2023 | |
| Dominican RepublicDOM | $290K | 1995 | — |
| GhanaGHA | $264.31K | 2022 | |
| AlgeriaDZA | $247.55K | 2023 | |
| ArmeniaARM | $243.7K | 2023 | |
| CubaCUB | $243.63K | 2023 | |
| NamibiaNAM | $233.66K | 2023 | |
| Somalia, Fed. Rep.SOM | $230.51K | 2023 | |
| SudanSDN | $227K | 2018 | |
| LiberiaLBR | $210K | 2008 | |
| SeychellesSYC | $190K | 2006 | |
| KenyaKEN | $180.4K | 2023 | |
| NigeriaNGA | $169.47K | 2022 | |
| TongaTON | $157.75K | 2022 | — |
| PeruPER | $156.46K | 2022 | |
| MauritaniaMRT | $145.26K | 2022 | |
| St. Vincent and the GrenadinesVCT | $140K | 2011 | |
| ArgentinaARG | $137.19K | 2023 |
Source: World Bank (WB WDI)