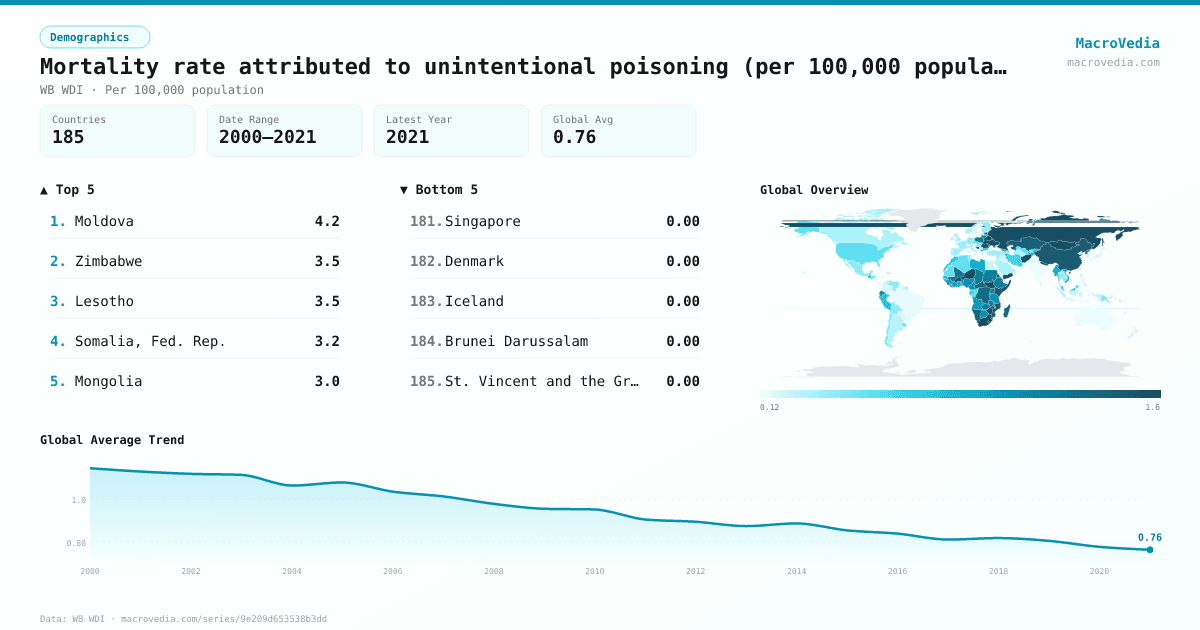
Mortality rate attributed to unintentional poisoning (per 100,000 population)
DemographicsWB WDIwb_wdi:SH.STA.POIS.P5•Per 100,000 population•2000 → 2021•185 countries
Series quick facts
High-level context for this country series.
DemographicsWB WDI
Coverage
185
Frequency
yearly
Range
2000 \u2192 2021
Latest
2021
Mortality rate attributed to unintentional poisoning (per 100,000 population) by country
Latest available value per country (as of 2021)
Low \u2192 High
Unit: Per 100,000 population
≤ 0.15
0.15 – 0.27
0.27 – 0.39
0.39 – 0.64
0.64 – 1.04
1.04 – 1.46
> 1.46
No data
Generated by MacroVedia.comSource: World Bank (WB WDI)
Highest 15 countries
Mortality rate attributed to unintentional poisoning (per 100,000 population)
50 countries with data
Generated by MacroVedia.comSource: World Bank (WB WDI)
Distribution across countries
Mortality rate attributed to unintentional poisoning (per 100,000 population)
Countries
50
Median
1.5
Mean
1.8
25th pctl
1.2
75th pctl
2
Generated by MacroVedia.comSource: World Bank (WB WDI)
Compare trends
Mortality rate attributed to unintentional poisoning (per 100,000 population)
MoldovaZimbabweLesotho
Generated by MacroVedia.comSource: World Bank (WB WDI)
| Country | Latest | Date | Trend |
|---|---|---|---|
| MoldovaMDA | 4.15 Per 100,000 population | 2021 | |
| ZimbabweZWE | 3.5 Per 100,000 population | 2021 | |
| LesothoLSO | 3.49 Per 100,000 population | 2021 | |
| Somalia, Fed. Rep.SOM | 3.17 Per 100,000 population | 2021 | |
| MongoliaMNG | 2.99 Per 100,000 population | 2021 | |
| EswatiniSWZ | 2.96 Per 100,000 population | 2021 | |
| NepalNPL | 2.93 Per 100,000 population | 2021 | |
| Russian FederationRUS | 2.75 Per 100,000 population | 2021 | |
| AfghanistanAFG | 2.5 Per 100,000 population | 2021 | |
| BurundiBDI | 2.26 Per 100,000 population | 2021 | |
| EritreaERI | 2.1 Per 100,000 population | 2021 | |
| UkraineUKR | 2.05 Per 100,000 population | 2021 | |
| LithuaniaLTU | 1.99 Per 100,000 population | 2020 | |
| RomaniaROU | 1.92 Per 100,000 population | 2021 | |
| Bosnia and HerzegovinaBIH | 1.87 Per 100,000 population | 2021 | |
| KiribatiKIR | 1.72 Per 100,000 population | 2021 | |
| GrenadaGRD | 1.69 Per 100,000 population | 2021 | |
| South AfricaZAF | 1.69 Per 100,000 population | 2021 | |
| South SudanSSD | 1.61 Per 100,000 population | 2021 | |
| Burkina FasoBFA | 1.58 Per 100,000 population | 2021 | |
| BelarusBLR | 1.58 Per 100,000 population | 2021 | |
| NigerNER | 1.56 Per 100,000 population | 2021 | |
| Yemen, Rep.YEM | 1.55 Per 100,000 population | 2021 | |
| DjiboutiDJI | 1.51 Per 100,000 population | 2021 | |
| KenyaKEN | 1.49 Per 100,000 population | 2021 | |
| ChinaCHN | 1.47 Per 100,000 population | 2021 | |
| MozambiqueMOZ | 1.47 Per 100,000 population | 2021 | |
| EstoniaEST | 1.42 Per 100,000 population | 2021 | |
| KazakhstanKAZ | 1.42 Per 100,000 population | 2021 | |
| ComorosCOM | 1.38 Per 100,000 population | 2021 | |
| NamibiaNAM | 1.38 Per 100,000 population | 2021 | |
| MadagascarMDG | 1.37 Per 100,000 population | 2021 | |
| Central African RepublicCAF | 1.36 Per 100,000 population | 2021 | |
| Congo, Dem. Rep.COD | 1.31 Per 100,000 population | 2021 | |
| RwandaRWA | 1.3 Per 100,000 population | 2021 | |
| Korea, Dem. People's Rep.PRK | 1.26 Per 100,000 population | 2021 | |
| TongaTON | 1.26 Per 100,000 population | 2021 | |
| MaliMLI | 1.24 Per 100,000 population | 2021 | |
| Sierra LeoneSLE | 1.24 Per 100,000 population | 2021 | |
| PolandPOL | 1.22 Per 100,000 population | 2021 | |
| ZambiaZMB | 1.18 Per 100,000 population | 2021 | |
| ChadTCD | 1.17 Per 100,000 population | 2021 | |
| EthiopiaETH | 1.16 Per 100,000 population | 2021 | |
| SudanSDN | 1.16 Per 100,000 population | 2021 | |
| UgandaUGA | 1.14 Per 100,000 population | 2021 | |
| MalawiMWI | 1.13 Per 100,000 population | 2021 | |
| GeorgiaGEO | 1.11 Per 100,000 population | 2021 | |
| TogoTGO | 1.11 Per 100,000 population | 2021 | |
| North MacedoniaMKD | 1.09 Per 100,000 population | 2021 | |
| BeninBEN | 1.08 Per 100,000 population | 2021 |
Source: World Bank (WB WDI)