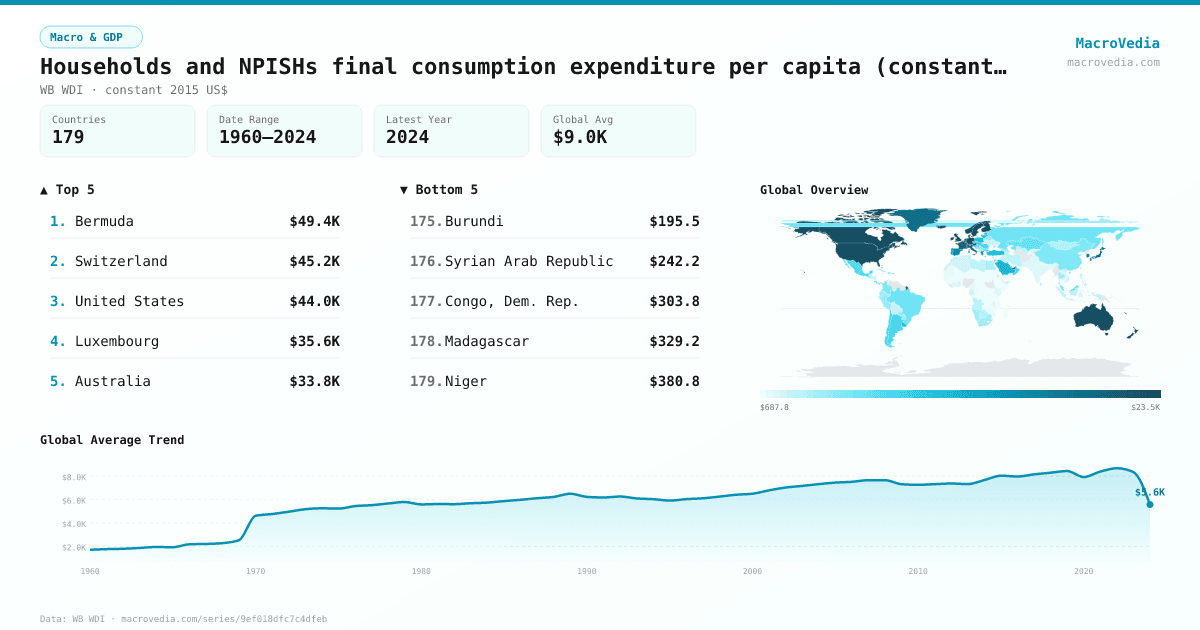
Households and NPISHs final consumption expenditure per capita (constant 2015 US$)
Macro & GDPWB WDIwb_wdi:NE.CON.PRVT.PC.KD•constant 2015 US$•1960 → 2024•179 countries
Series quick facts
High-level context for this country series.
Macro & GDPWB WDI
Coverage
179
Frequency
yearly
Range
1960 \u2192 2024
Latest
2024
Households and NPISHs final consumption expenditure per capita (constant 2015 US$) by country
Latest available value per country (as of 2024)
Low \u2192 High
Unit: US$
≤ 934.65
934.65 – 2.17K
2.17K – 3.58K
3.58K – 6.29K
6.29K – 10.93K
10.93K – 20.89K
> 20.89K
No data
Generated by MacroVedia.comSource: World Bank (WB WDI)
Highest 15 countries
Households and NPISHs final consumption expenditure per capita (constant 2015 US$)
50 countries with data
Generated by MacroVedia.comSource: World Bank (WB WDI)
Distribution across countries
Households and NPISHs final consumption expenditure per capita (constant 2015 US$)
Countries
50
Median
$21.09K
Mean
$22.59K
25th pctl
$15.74K
75th pctl
$26.1K
Generated by MacroVedia.comSource: World Bank (WB WDI)
Compare trends
Households and NPISHs final consumption expenditure per capita (constant 2015 US$)
AustraliaSingaporeKorea, Rep.
Generated by MacroVedia.comSource: World Bank (WB WDI)
| Country | Latest | Date | Trend |
|---|---|---|---|
| BermudaBMU | $49.42K | 2024 | |
| SwitzerlandCHE | $45.24K | 2023 | |
| United StatesUSA | $43.96K | 2022 | |
| LuxembourgLUX | $35.63K | 2023 | |
| AustraliaAUS | $33.78K | 2024 | |
| NorwayNOR | $33.5K | 2023 | |
| IcelandISL | $31.27K | 2023 | |
| Hong Kong SAR, ChinaHKG | $30.07K | 2024 | |
| United KingdomGBR | $29.26K | 2023 | |
| DenmarkDNK | $27.36K | 2023 | |
| Puerto Rico (US)PRI | $26.72K | 2024 | |
| New ZealandNZL | $26.16K | 2022 | |
| CanadaCAN | $26.1K | 2023 | |
| Faroe IslandsFRO | $24.71K | 2015 | — |
| FinlandFIN | $24.58K | 2023 | |
| SwedenSWE | $24.4K | 2023 | |
| SingaporeSGP | $24.29K | 2024 | |
| Virgin Islands (U.S.)VIR | $24.19K | 2022 | |
| AustriaAUT | $23.3K | 2023 | |
| United Arab EmiratesARE | $22.91K | 2023 | |
| IrelandIRL | $22.6K | 2023 | |
| GermanyDEU | $22.55K | 2023 | |
| BelgiumBEL | $22.08K | 2023 | |
| NetherlandsNLD | $21.46K | 2023 | |
| IsraelISR | $21.23K | 2023 | |
| Bahamas, TheBHS | $20.96K | 2024 | |
| GuamGUM | $20.8K | 2022 | |
| San MarinoSMR | $20.79K | 2023 | |
| Macao SAR, ChinaMAC | $20.76K | 2024 | |
| FranceFRA | $20.67K | 2023 | |
| New CaledoniaNCL | $20.17K | 2015 | — |
| CyprusCYP | $20.15K | 2024 | |
| ItalyITA | $19.74K | 2023 | |
| JapanJPN | $19.53K | 2022 | |
| GreenlandGRL | $18.87K | 2023 | |
| Korea, Rep.KOR | $17.6K | 2024 | |
| MaltaMLT | $16.47K | 2024 | |
| SpainESP | $15.74K | 2023 | |
| QatarQAT | $15.38K | 2015 | — |
| ArubaABW | $15.12K | 2015 | — |
| GreeceGRC | $14.51K | 2023 | |
| PortugalPRT | $14.33K | 2023 | |
| Northern Mariana IslandsMNP | $13.9K | 2022 | |
| SloveniaSVN | $13.81K | 2023 | |
| CuracaoCUW | $13.41K | 2015 | — |
| SeychellesSYC | $12.53K | 2024 | |
| French PolynesiaPYF | $12.52K | 2015 | — |
| Saudi ArabiaSAU | $11.87K | 2024 | |
| BahrainBHR | $11.57K | 2024 | |
| UruguayURY | $11.45K | 2015 | — |
Source: World Bank (WB WDI)