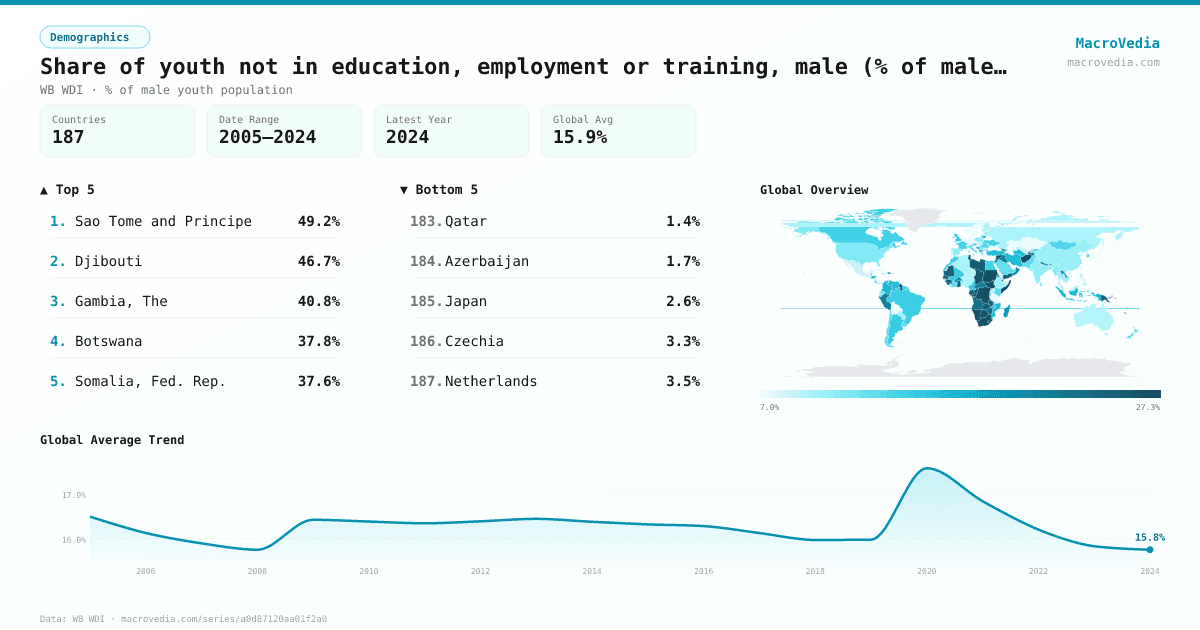
Share of youth not in education, employment or training, male (% of male youth population) (modeled ILO estimate)
DemographicsWB WDIwb_wdi:SL.UEM.NEET.MA.ME.ZS•% of male youth population•2005 → 2024•187 countries
Series quick facts
High-level context for this country series.
DemographicsWB WDI
Coverage
187
Frequency
yearly
Range
2005 \u2192 2024
Latest
2024
Share of youth not in education, employment or training, male (% of male youth population) (modeled ILO estimate) by country
Latest available value per country (as of 2024)
Low \u2192 High
Unit: %
≤ 7.99%
7.99% – 10.05%
10.05% – 12.55%
12.55% – 15.28%
15.28% – 19.78%
19.78% – 25.43%
> 25.43%
No data
Generated by MacroVedia.comSource: World Bank (WB WDI)
Highest 15 countries
Share of youth not in education, employment or training, male (% of male youth population) (modeled ILO estimate)
50 countries with data
Generated by MacroVedia.comSource: World Bank (WB WDI)
Distribution across countries
Share of youth not in education, employment or training, male (% of male youth population) (modeled ILO estimate)
Countries
50
Median
25.9%
Mean
27.6%
25th pctl
23.4%
75th pctl
30%
Generated by MacroVedia.comSource: World Bank (WB WDI)
Compare trends
Share of youth not in education, employment or training, male (% of male youth population) (modeled ILO estimate)
Sao Tome and PrincipeDjiboutiGambia, The
Generated by MacroVedia.comSource: World Bank (WB WDI)
| Country | Latest | Date | Trend |
|---|---|---|---|
| Sao Tome and PrincipeSTP | 49.24% | 2024 | |
| DjiboutiDJI | 46.71% | 2024 | |
| Gambia, TheGMB | 40.82% | 2024 | |
| BotswanaBWA | 37.79% | 2024 | |
| Somalia, Fed. Rep.SOM | 37.57% | 2024 | |
| GuyanaGUY | 35.88% | 2024 | |
| EswatiniSWZ | 33.98% | 2024 | |
| South AfricaZAF | 33.63% | 2024 | |
| LesothoLSO | 32.64% | 2024 | |
| South SudanSSD | 30.46% | 2023 | |
| VanuatuVUT | 30.46% | 2024 | |
| SudanSDN | 30.1% | 2022 | |
| BarbadosBRB | 29.97% | 2024 | |
| AfghanistanAFG | 28.96% | 2024 | |
| Timor-LesteTLS | 28.67% | 2024 | |
| Sierra LeoneSLE | 28.52% | 2024 | |
| NamibiaNAM | 28.04% | 2024 | |
| SamoaWSM | 27.66% | 2024 | |
| Congo, Dem. Rep.COD | 27.48% | 2024 | |
| Cabo VerdeCPV | 27.1% | 2024 | |
| SenegalSEN | 26.81% | 2024 | |
| Syrian Arab RepublicSYR | 26.62% | 2024 | |
| JordanJOR | 26.3% | 2024 | |
| ChadTCD | 26.15% | 2024 | |
| Congo, Rep.COG | 26.15% | 2024 | |
| LibyaLBY | 25.56% | 2024 | |
| ZambiaZMB | 25.54% | 2024 | |
| GuineaGIN | 25.35% | 2024 | |
| GabonGAB | 25.2% | 2024 | |
| GhanaGHA | 25.14% | 2024 | |
| TajikistanTJK | 25.09% | 2024 | |
| TunisiaTUN | 24.52% | 2024 | |
| Papua New GuineaPNG | 24.48% | 2024 | |
| MauritaniaMRT | 24.46% | 2024 | |
| St. LuciaLCA | 24.23% | 2024 | |
| Yemen, Rep.YEM | 24.11% | 2024 | |
| ZimbabweZWE | 23.84% | 2024 | |
| TongaTON | 23.37% | 2024 | |
| AngolaAGO | 23.35% | 2024 | |
| St. Vincent and the GrenadinesVCT | 22.83% | 2024 | |
| New CaledoniaNCL | 22.68% | 2024 | |
| AlbaniaALB | 22.4% | 2024 | |
| GeorgiaGEO | 22.28% | 2024 | |
| MaldivesMDV | 21.88% | 2024 | |
| RwandaRWA | 21.78% | 2024 | |
| Central African RepublicCAF | 21.33% | 2024 | |
| Puerto Rico (US)PRI | 21.27% | 2024 | |
| PeruPER | 21.22% | 2024 | |
| IraqIRQ | 20.97% | 2024 | |
| Equatorial GuineaGNQ | 20.96% | 2024 |
Source: World Bank (WB WDI)