Child employment in agriculture, female (% of female economically active children ages 7-
DemographicsWB WDIwb_wdi:SL.AGR.0714.FE.ZS•Percent•1998 → 2016•65 countries
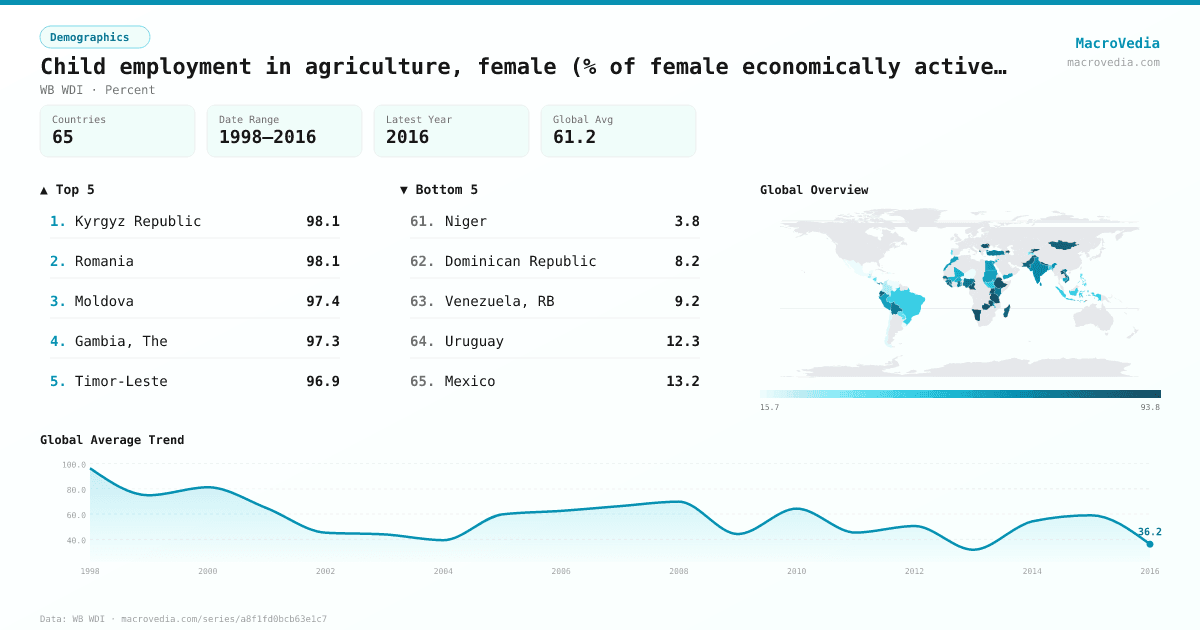
Series quick facts
High-level context for this country series.
DemographicsWB WDI
Coverage
65
Frequency
—
Range
1998 \u2192 2016
Latest
2016
Child employment in agriculture, female (% of female economically active children ages 7- by country
Latest available value per country (as of 2016)
Low \u2192 High
Unit: %
≤ 20.88%
20.88% – 47.02%
47.02% – 61.72%
61.72% – 71.85%
71.85% – 82.85%
82.85% – 91.49%
> 91.49%
No data
Generated by MacroVedia.comSource: World Bank (WB WDI)
Highest 15 countries
Child employment in agriculture, female (% of female economically active children ages 7-
50 countries with data
Generated by MacroVedia.comSource: World Bank (WB WDI)
Distribution across countries
Child employment in agriculture, female (% of female economically active children ages 7-
Countries
50
Median
73.5%
Mean
74.4%
25th pctl
61.3%
75th pctl
90.1%
Generated by MacroVedia.comSource: World Bank (WB WDI)
Compare trends
Child employment in agriculture, female (% of female economically active children ages 7-
BrazilBoliviaEcuador
Generated by MacroVedia.comSource: World Bank (WB WDI)
| Country | Latest | Date | Trend |
|---|---|---|---|
| Kyrgyz RepublicKGZ | 98.15% | 2014 | |
| RomaniaROU | 98.12% | 2000 | — |
| MoldovaMDA | 97.41% | 2009 | — |
| Gambia, TheGMB | 97.29% | 2015 | — |
| Timor-LesteTLS | 96.89% | 2007 | — |
| UgandaUGA | 96.19% | 2012 | |
| Burkina FasoBFA | 96.1% | 2003 | — |
| Lao PDRLAO | 94.31% | 2010 | — |
| TanzaniaTZA | 93.06% | 2014 | |
| NamibiaNAM | 91.5% | 1999 | — |
| AzerbaijanAZE | 91.4% | 2005 | — |
| EthiopiaETH | 91.4% | 2005 | — |
| ZambiaZMB | 90.11% | 2008 | |
| NepalNPL | 88.93% | 2008 | |
| CameroonCMR | 86.76% | 2007 | |
| MongoliaMNG | 85.37% | 2012 | |
| AlbaniaALB | 84.14% | 2010 | — |
| MadagascarMDG | 83.9% | 2007 | |
| Sierra LeoneSLE | 83.3% | 2007 | — |
| PakistanPAK | 81.73% | 2011 | |
| EcuadorECU | 79.38% | 2015 | |
| SenegalSEN | 78.76% | 2011 | |
| NigeriaNGA | 76.65% | 2010 | — |
| KenyaKEN | 74.45% | 1999 | — |
| LiberiaLBR | 73.6% | 2010 | — |
| BoliviaBOL | 73.46% | 2015 | |
| Viet NamVNM | 72.73% | 2012 | — |
| GuineaGIN | 72.32% | 2010 | — |
| TurkiyeTUR | 71.22% | 2006 | |
| RwandaRWA | 71.2% | 2014 | |
| GhanaGHA | 71.19% | 2012 | |
| PanamaPAN | 70.88% | 2014 | |
| IndiaIND | 68.62% | 2012 | |
| MalawiMWI | 68.01% | 2015 | — |
| Sri LankaLKA | 66.32% | 2009 | |
| TogoTGO | 64.26% | 2010 | |
| Egypt, Arab Rep.EGY | 62.23% | 2009 | — |
| PeruPER | 61.33% | 2007 | |
| MoroccoMAR | 61.27% | 2004 | |
| Yemen, Rep.YEM | 60.98% | 2010 | |
| SudanSDN | 59.7% | 2008 | — |
| CambodiaKHM | 58.24% | 2012 | |
| MaliMLI | 56.45% | 2007 | |
| JordanJOR | 52.17% | 2016 | |
| South SudanSSD | 49.38% | 2008 | — |
| IndonesiaIDN | 48.11% | 2010 | |
| BangladeshBGD | 46.59% | 2013 | |
| BrazilBRA | 44.4% | 2015 | |
| PortugalPRT | 40.67% | 2001 | — |
| NicaraguaNIC | 38.91% | 2012 |
Source: World Bank (WB WDI)