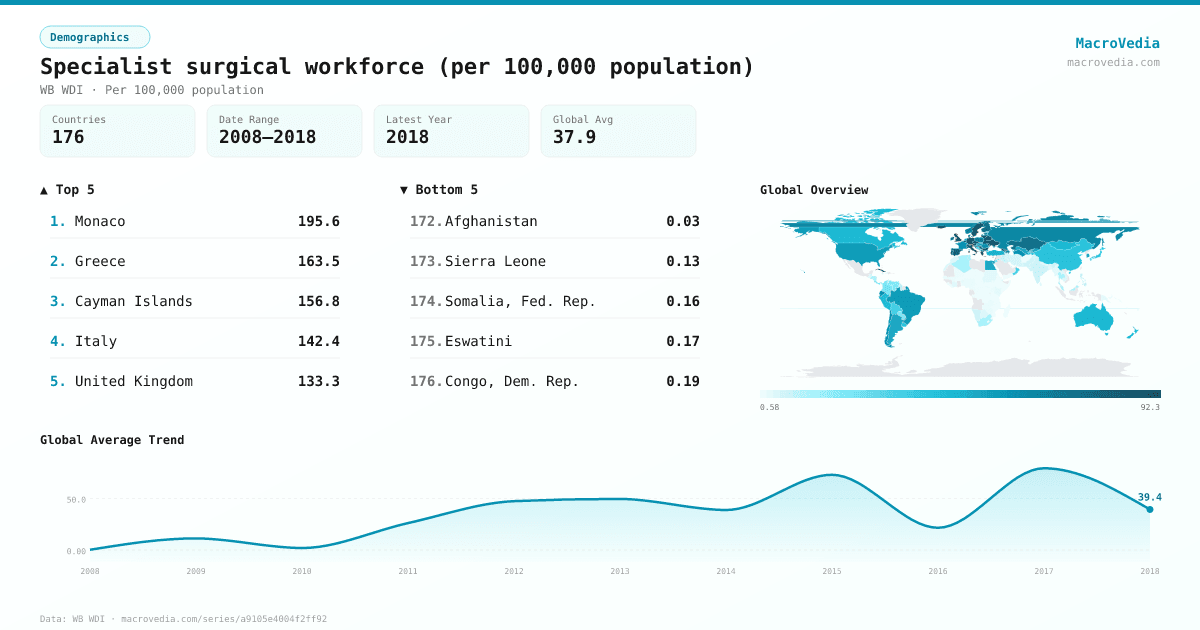
Specialist surgical workforce (per 100,000 population)
DemographicsWB WDIwb_wdi:SH.MED.SAOP.P5•Per 100,000 population•2008 → 2018•176 countries
Series quick facts
High-level context for this country series.
DemographicsWB WDI
Coverage
176
Frequency
—
Range
2008 \u2192 2018
Latest
2018
Specialist surgical workforce (per 100,000 population) by country
Latest available value per country (as of 2018)
Low \u2192 High
Unit: Per 100,000 population
≤ 1.05
1.05 – 5.02
5.02 – 14.04
14.04 – 32.62
32.62 – 55.69
55.69 – 86.09
> 86.09
No data
Generated by MacroVedia.comSource: World Bank (WB WDI)
Highest 15 countries
Specialist surgical workforce (per 100,000 population)
50 countries with data
Generated by MacroVedia.comSource: World Bank (WB WDI)
Distribution across countries
Specialist surgical workforce (per 100,000 population)
Countries
50
Median
86.1
Mean
93.5
25th pctl
67.9
75th pctl
112.9
Generated by MacroVedia.comSource: World Bank (WB WDI)
Compare trends
Specialist surgical workforce (per 100,000 population)
GreeceItalyGeorgia
Generated by MacroVedia.comSource: World Bank (WB WDI)
| Country | Latest | Date | Trend |
|---|---|---|---|
| MonacoMCO | 195.6 Per 100,000 population | 2014 | — |
| GreeceGRC | 163.54 Per 100,000 population | 2015 | |
| Cayman IslandsCYM | 156.75 Per 100,000 population | 2015 | |
| ItalyITA | 142.4 Per 100,000 population | 2017 | |
| United KingdomGBR | 133.3 Per 100,000 population | 2015 | |
| LithuaniaLTU | 130.92 Per 100,000 population | 2015 | |
| GeorgiaGEO | 130.44 Per 100,000 population | 2016 | |
| EstoniaEST | 126.56 Per 100,000 population | 2014 | — |
| CzechiaCZE | 124.52 Per 100,000 population | 2013 | — |
| BelarusBLR | 124.24 Per 100,000 population | 2014 | |
| MaltaMLT | 113.46 Per 100,000 population | 2017 | |
| SwedenSWE | 113.11 Per 100,000 population | 2015 | |
| San MarinoSMR | 112.86 Per 100,000 population | 2017 | |
| BulgariaBGR | 112.71 Per 100,000 population | 2018 | |
| AustriaAUT | 109.88 Per 100,000 population | 2015 | |
| GermanyDEU | 108 Per 100,000 population | 2015 | |
| IcelandISL | 101.57 Per 100,000 population | 2015 | |
| CubaCUB | 100.89 Per 100,000 population | 2017 | |
| SwitzerlandCHE | 94.76 Per 100,000 population | 2017 | |
| BelgiumBEL | 89.76 Per 100,000 population | 2015 | |
| LebanonLBN | 87.4 Per 100,000 population | 2014 | — |
| SerbiaSRB | 86.72 Per 100,000 population | 2016 | |
| ArmeniaARM | 86.66 Per 100,000 population | 2017 | |
| UkraineUKR | 86.55 Per 100,000 population | 2014 | |
| MoldovaMDA | 86.12 Per 100,000 population | 2014 | |
| PortugalPRT | 86.09 Per 100,000 population | 2015 | |
| CyprusCYP | 84.42 Per 100,000 population | 2018 | |
| AndorraAND | 83.11 Per 100,000 population | 2018 | |
| CroatiaHRV | 81.24 Per 100,000 population | 2015 | |
| LuxembourgLUX | 80.75 Per 100,000 population | 2016 | |
| SpainESP | 79.9 Per 100,000 population | 2014 | — |
| FinlandFIN | 76.3 Per 100,000 population | 2014 | — |
| IsraelISR | 75.59 Per 100,000 population | 2015 | |
| KazakhstanKAZ | 73.15 Per 100,000 population | 2015 | |
| IrelandIRL | 71.97 Per 100,000 population | 2018 | |
| LiechtensteinLIE | 71.94 Per 100,000 population | 2015 | |
| DenmarkDNK | 68.98 Per 100,000 population | 2014 | |
| PolandPOL | 67.86 Per 100,000 population | 2015 | |
| AzerbaijanAZE | 67.63 Per 100,000 population | 2014 | |
| LatviaLVA | 67.62 Per 100,000 population | 2016 | |
| NorwayNOR | 67.16 Per 100,000 population | 2017 | |
| SloveniaSVN | 66.7 Per 100,000 population | 2018 | |
| MontenegroMNE | 64.12 Per 100,000 population | 2016 | |
| Russian FederationRUS | 63.12 Per 100,000 population | 2014 | — |
| North MacedoniaMKD | 61.22 Per 100,000 population | 2015 | |
| RomaniaROU | 60.53 Per 100,000 population | 2015 | |
| EcuadorECU | 59.39 Per 100,000 population | 2014 | — |
| ChileCHL | 59.32 Per 100,000 population | 2012 | — |
| TurkmenistanTKM | 58.81 Per 100,000 population | 2014 | |
| FranceFRA | 58.63 Per 100,000 population | 2015 |
Source: World Bank (WB WDI)