Current education expenditure, tertiary (% of total expenditure in tertiary public institutions)
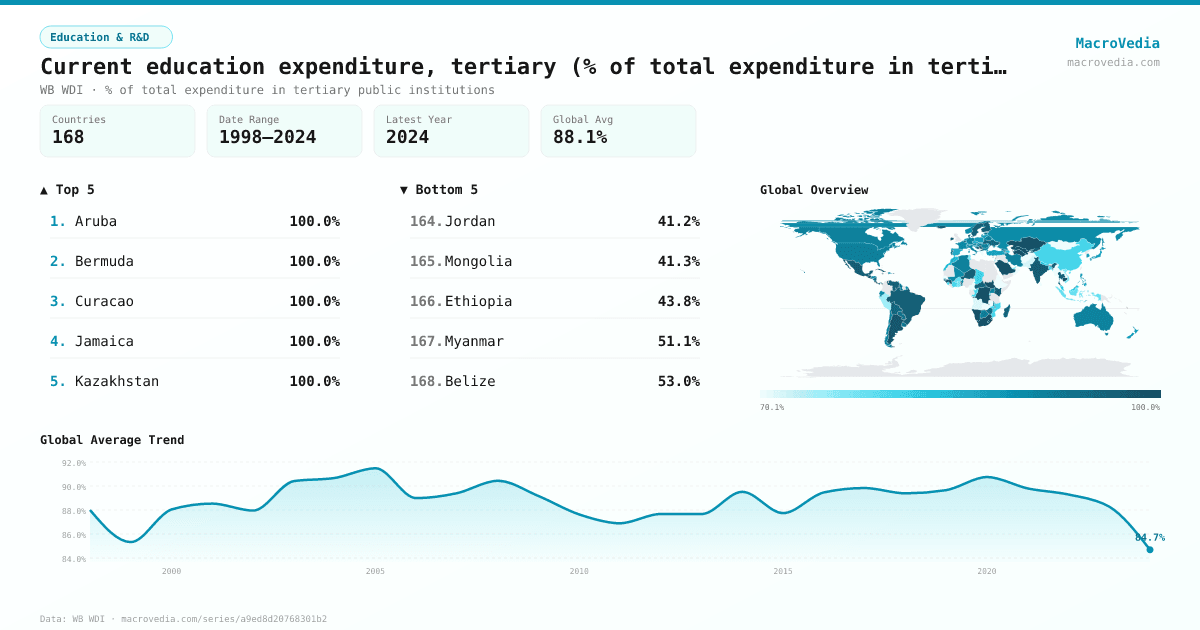
Education & R&DWB WDIwb_wdi:SE.XPD.CTER.ZS•% of total expenditure in tertiary public institutions•1998 → 2024•168 countries
Series quick facts
High-level context for this country series.
Education & R&DWB WDI
Coverage
168
Frequency
yearly
Range
1998 \u2192 2024
Latest
2024
Current education expenditure, tertiary (% of total expenditure in tertiary public institutions) by country
Latest available value per country (as of 2024)
Low \u2192 High
Unit: %
≤ 76.68%
76.68% – 86.53%
86.53% – 90.62%
90.62% – 94.71%
94.71% – 97.45%
97.45% – 99.87%
> 99.87%
No data
Generated by MacroVedia.comSource: World Bank (WB WDI)
Highest 15 countries
Current education expenditure, tertiary (% of total expenditure in tertiary public institutions)
50 countries with data
Generated by MacroVedia.comSource: World Bank (WB WDI)
Distribution across countries
Current education expenditure, tertiary (% of total expenditure in tertiary public institutions)
Countries
50
Median
99.8%
Mean
99.2%
25th pctl
98.6%
75th pctl
100%
Generated by MacroVedia.comSource: World Bank (WB WDI)
Compare trends
Current education expenditure, tertiary (% of total expenditure in tertiary public institutions)
IrelandMexicoArgentina
Generated by MacroVedia.comSource: World Bank (WB WDI)
| Country | Latest | Date | Trend |
|---|---|---|---|
| ArubaABW | 100% | 2016 | |
| BermudaBMU | 100% | 2023 | |
| CuracaoCUW | 100% | 2013 | — |
| JamaicaJAM | 100% | 2024 | |
| KazakhstanKAZ | 100% | 2019 | |
| CambodiaKHM | 100% | 2014 | |
| St. Kitts and NevisKNA | 100% | 2016 | |
| LebanonLBN | 100% | 2012 | |
| St. LuciaLCA | 100% | 2023 | |
| LesothoLSO | 100% | 2018 | |
| Marshall IslandsMHL | 100% | 2022 | |
| MongoliaMNG | 100% | 2015 | |
| NamibiaNAM | 100% | 2014 | |
| Puerto Rico (US)PRI | 100% | 2014 | |
| Saudi ArabiaSAU | 100% | 2021 | — |
| South SudanSSD | 100% | 2016 | |
| SeychellesSYC | 100% | 2016 | |
| UzbekistanUZB | 100% | 2021 | |
| St. Vincent and the GrenadinesVCT | 100% | 2009 | |
| British Virgin IslandsVGB | 100% | 2007 | — |
| SamoaWSM | 100% | 2016 | — |
| ComorosCOM | 100% | 2015 | |
| South AfricaZAF | 100% | 2024 | |
| MaldivesMDV | 99.96% | 2016 | |
| Congo, Dem. Rep.COD | 99.85% | 2013 | |
| TurkmenistanTKM | 99.69% | 2023 | |
| TogoTGO | 99.59% | 2017 | |
| GuatemalaGTM | 99.49% | 2024 | |
| EswatiniSWZ | 99.47% | 2014 | — |
| El SalvadorSLV | 99.31% | 2024 | |
| VanuatuVUT | 99.25% | 2020 | |
| CubaCUB | 99.18% | 2010 | |
| SingaporeSGP | 99.1% | 2023 | |
| North MacedoniaMKD | 98.88% | 2002 | — |
| MauritiusMUS | 98.64% | 2010 | — |
| Turks and Caicos IslandsTCA | 98.63% | 2015 | |
| GuineaGIN | 98.62% | 2020 | |
| Antigua and BarbudaATG | 98.62% | 2011 | |
| BarbadosBRB | 98.58% | 2023 | |
| American SamoaASM | 98.25% | 2006 | — |
| ArgentinaARG | 98.22% | 2022 | |
| LuxembourgLUX | 98.21% | 2022 | |
| Kyrgyz RepublicKGZ | 97.99% | 2021 | |
| San MarinoSMR | 97.88% | 2023 | |
| KenyaKEN | 97.62% | 2015 | |
| IcelandISL | 97.6% | 2022 | |
| IndiaIND | 97.55% | 2005 | |
| Brunei DarussalamBRN | 97.45% | 2016 | — |
| MexicoMEX | 97.45% | 2022 | |
| IrelandIRL | 97.4% | 2021 |
Source: World Bank (WB WDI)