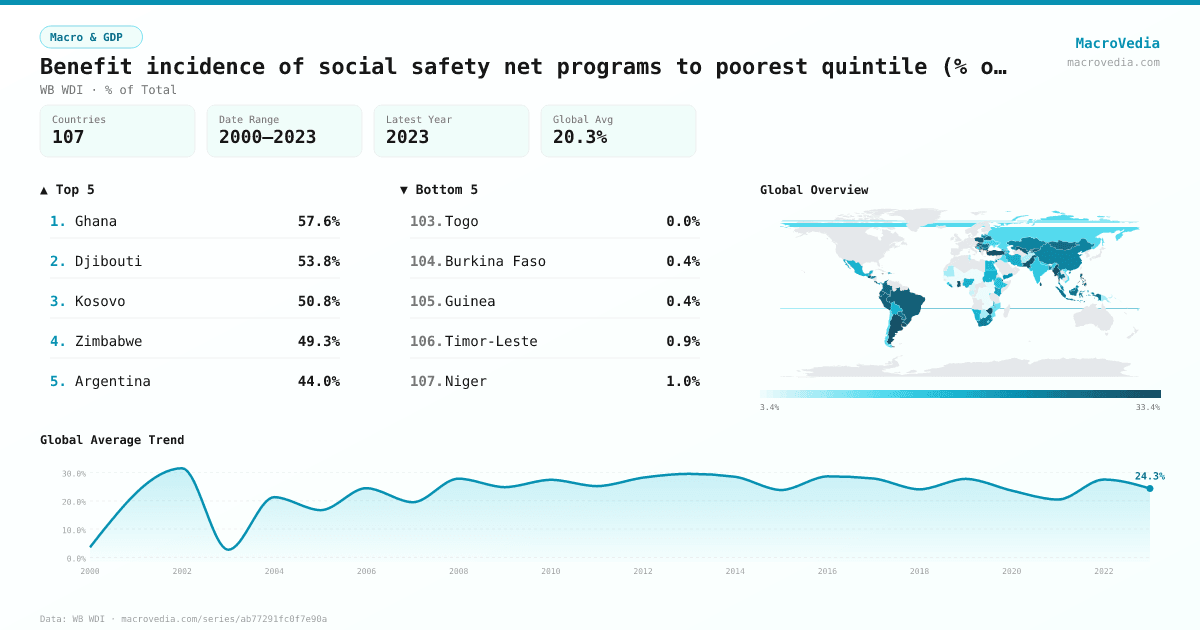
Benefit incidence of social safety net programs to poorest quintile (% of total safety net benefits)
Macro & GDPWB WDIwb_wdi:per_sa_allsa.ben_q1_tot•% of Total•2000 → 2023•107 countries
Series quick facts
High-level context for this country series.
Macro & GDPWB WDI
Coverage
107
Frequency
—
Range
2000 \u2192 2023
Latest
2023
Benefit incidence of social safety net programs to poorest quintile (% of total safety net benefits) by country
Latest available value per country (as of 2023)
Low \u2192 High
Unit: %
≤ 4.85%
4.85% – 13.43%
13.43% – 17.75%
17.75% – 23.59%
23.59% – 28.08%
28.08% – 31.01%
> 31.01%
No data
Generated by MacroVedia.comSource: World Bank (WB WDI)
Highest 15 countries
Benefit incidence of social safety net programs to poorest quintile (% of total safety net benefits)
50 countries with data
Generated by MacroVedia.comSource: World Bank (WB WDI)
Distribution across countries
Benefit incidence of social safety net programs to poorest quintile (% of total safety net benefits)
Countries
50
Median
29.4%
Mean
31.4%
25th pctl
25.9%
75th pctl
31.8%
Generated by MacroVedia.comSource: World Bank (WB WDI)
Compare trends
Benefit incidence of social safety net programs to poorest quintile (% of total safety net benefits)
TurkiyeArmeniaPeru
Generated by MacroVedia.comSource: World Bank (WB WDI)
| Country | Latest | Date | Trend |
|---|---|---|---|
| GhanaGHA | 57.56% | 2016 | — |
| DjiboutiDJI | 53.82% | 2012 | — |
| KosovoXKX | 50.81% | 2017 | |
| ZimbabweZWE | 49.34% | 2019 | |
| ArgentinaARG | 43.98% | 2022 | |
| UruguayURY | 43.44% | 2022 | |
| MontenegroMNE | 43.12% | 2014 | |
| CroatiaHRV | 38.98% | 2014 | |
| Slovak RepublicSVK | 38.4% | 2009 | — |
| TurkiyeTUR | 37.97% | 2019 | |
| HungaryHUN | 34.21% | 2007 | — |
| MyanmarMMR | 32.84% | 2017 | — |
| Costa RicaCRI | 31.75% | 2022 | |
| JamaicaJAM | 31.73% | 2017 | |
| PakistanPAK | 31.63% | 2018 | |
| SerbiaSRB | 31.03% | 2022 | |
| PhilippinesPHL | 30.9% | 2018 | |
| Sri LankaLKA | 30.6% | 2019 | |
| GuatemalaGTM | 30.47% | 2011 | |
| ArmeniaARM | 30.43% | 2022 | |
| PeruPER | 30.27% | 2022 | |
| MoldovaMDA | 30.23% | 2018 | |
| BrazilBRA | 30.16% | 2022 | |
| EcuadorECU | 29.71% | 2022 | |
| UzbekistanUZB | 29.57% | 2018 | — |
| PolandPOL | 29.31% | 2019 | |
| Kyrgyz RepublicKGZ | 29.26% | 2020 | |
| BelarusBLR | 28.83% | 2019 | |
| El SalvadorSLV | 28.44% | 2022 | |
| ColombiaCOL | 28.44% | 2022 | |
| BulgariaBGR | 28.14% | 2007 | — |
| MongoliaMNG | 27.93% | 2020 | |
| AlbaniaALB | 27.65% | 2012 | |
| RomaniaROU | 26.59% | 2021 | |
| IndonesiaIDN | 26.47% | 2022 | |
| ParaguayPRY | 26.45% | 2022 | |
| ThailandTHA | 26.08% | 2021 | |
| BangladeshBGD | 25.86% | 2022 | |
| HondurasHND | 25.63% | 2019 | |
| South AfricaZAF | 25.53% | 2014 | |
| LithuaniaLTU | 24.78% | 2008 | — |
| KazakhstanKAZ | 24.77% | 2021 | |
| MalaysiaMYS | 24.64% | 2016 | |
| PanamaPAN | 24.35% | 2023 | |
| ChinaCHN | 24.24% | 2013 | — |
| KiribatiKIR | 24.03% | 2019 | — |
| EswatiniSWZ | 23% | 2016 | |
| JordanJOR | 22.7% | 2010 | |
| Yemen, Rep.YEM | 22.59% | 2014 | |
| LiberiaLBR | 22.54% | 2016 |
Source: World Bank (WB WDI)