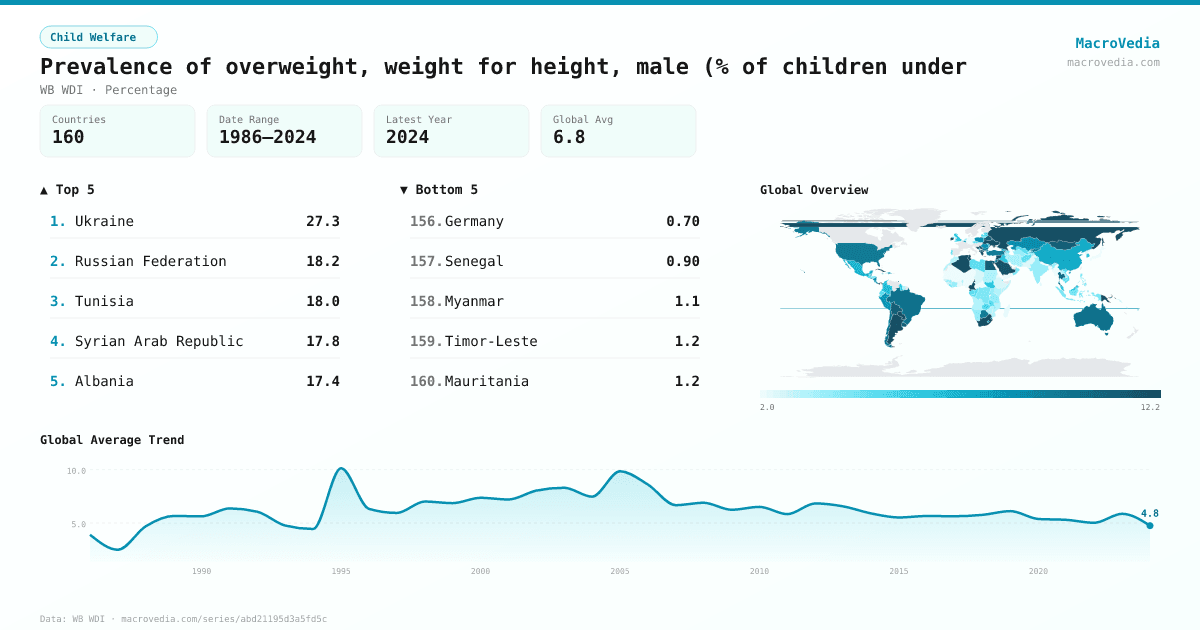
Prevalence of overweight, weight for height, male (% of children under
Child WelfareWB WDIwb_wdi:SH.STA.OWGH.MA.ZS•Percentage•1986 → 2024•160 countries
Series quick facts
High-level context for this country series.
Child WelfareWB WDI
Coverage
160
Frequency
—
Range
1986 \u2192 2024
Latest
2023
Prevalence of overweight, weight for height, male (% of children under by country
Latest available value per country (as of 2023)
Low \u2192 High
Unit: %
≤ 2.9%
2.9% – 4.1%
4.1% – 5.23%
5.23% – 7.96%
7.96% – 10.06%
10.06% – 12.2%
> 12.2%
No data
Generated by MacroVedia.comSource: World Bank (WB WDI)
Highest 15 countries
Prevalence of overweight, weight for height, male (% of children under
50 countries with data
Generated by MacroVedia.comSource: World Bank (WB WDI)
Distribution across countries
Prevalence of overweight, weight for height, male (% of children under
Countries
50
Median
12%
Mean
13.6%
25th pctl
11.1%
75th pctl
14.5%
Generated by MacroVedia.comSource: World Bank (WB WDI)
Compare trends
Prevalence of overweight, weight for height, male (% of children under
Russian FederationEgypt, Arab Rep.Uruguay
Generated by MacroVedia.comSource: World Bank (WB WDI)
| Country | Latest | Date | Trend |
|---|---|---|---|
| LibyaLBY | 30.1% | 2014 | |
| UkraineUKR | 27.3% | 2000 | — |
| MontenegroMNE | 24.7% | 2013 | |
| GeorgiaGEO | 21.3% | 2009 | |
| Russian FederationRUS | 18.2% | 2005 | |
| TunisiaTUN | 18% | 2018 | |
| Syrian Arab RepublicSYR | 17.8% | 2010 | |
| AlbaniaALB | 17.4% | 2017 | |
| Bosnia and HerzegovinaBIH | 16.7% | 2012 | |
| AzerbaijanAZE | 15.1% | 2013 | |
| KazakhstanKAZ | 14.8% | 2010 | |
| ArmeniaARM | 14.6% | 2016 | |
| Turks and Caicos IslandsTCA | 14.5% | 2020 | — |
| Papua New GuineaPNG | 14.3% | 2010 | |
| AlgeriaDZA | 13.4% | 2019 | |
| GreeceGRC | 13.2% | 2003 | — |
| North MacedoniaMKD | 13.1% | 2019 | |
| ParaguayPRY | 13% | 2016 | |
| Trinidad and TobagoTTO | 13% | 2011 | |
| SerbiaSRB | 12.7% | 2019 | |
| IrelandIRL | 12.4% | 2011 | — |
| MoroccoMAR | 12.4% | 2017 | |
| CameroonCMR | 12.2% | 2018 | |
| TongaTON | 12.2% | 2019 | |
| ArgentinaARG | 12% | 2018 | |
| MaltaMLT | 12% | 2022 | — |
| South AfricaZAF | 12% | 2017 | |
| CubaCUB | 11.9% | 2019 | — |
| IraqIRQ | 11.8% | 2011 | |
| PanamaPAN | 11.8% | 2019 | |
| Saudi ArabiaSAU | 11.8% | 2020 | |
| Equatorial GuineaGNQ | 11.6% | 2011 | |
| BelarusBLR | 11.3% | 2005 | — |
| BarbadosBRB | 11.3% | 2012 | — |
| Egypt, Arab Rep.EGY | 11.3% | 2021 | |
| ComorosCOM | 11.2% | 2012 | |
| MongoliaMNG | 11.2% | 2018 | |
| BoliviaBOL | 11.1% | 2016 | |
| UruguayURY | 11% | 2018 | |
| South SudanSSD | 10.7% | 2006 | — |
| QatarQAT | 10.5% | 2023 | |
| ThailandTHA | 10.5% | 2022 | |
| SeychellesSYC | 10.4% | 2012 | — |
| West Bank and GazaPSE | 10.2% | 2020 | |
| EswatiniSWZ | 10.2% | 2021 | |
| AustraliaAUS | 10.1% | 2007 | — |
| BrazilBRA | 10% | 2019 | |
| ChileCHL | 10% | 2014 | |
| BulgariaBGR | 9.6% | 2014 | |
| BotswanaBWA | 9.6% | 2007 |
Source: World Bank (WB WDI)