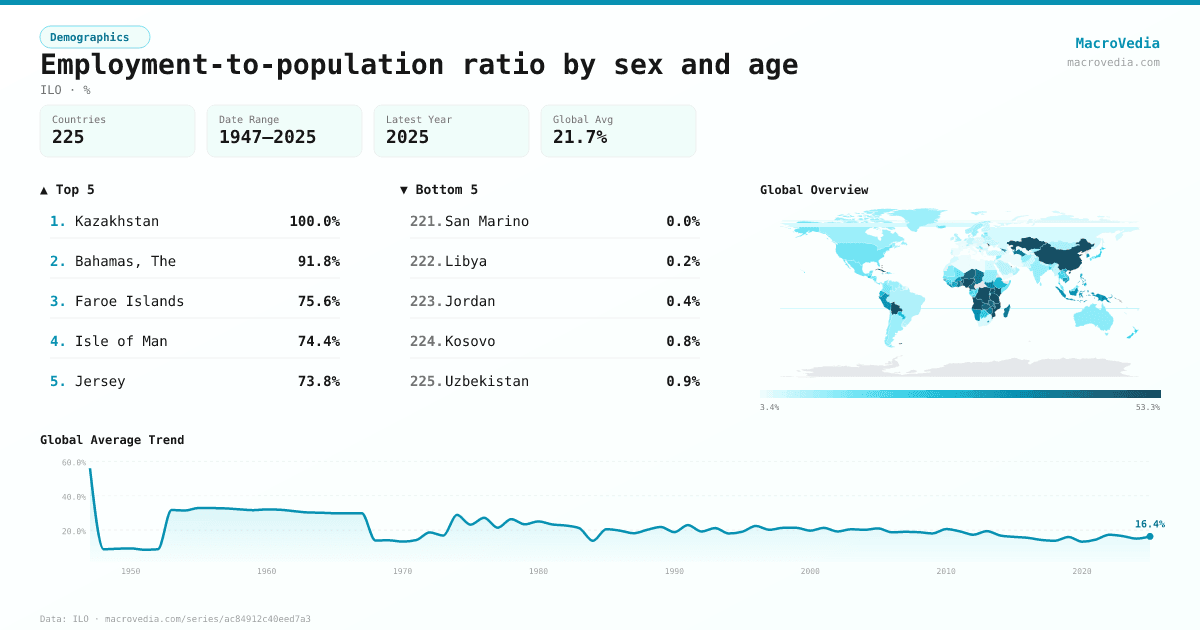
Employment-to-population ratio by sex and age
DemographicsILOilostat:EMP_DWAP_SEX_AGE_RT_A•%•1947 → 2025•217 countries
Series quick facts
High-level context for this country series.
DemographicsILO
Coverage
217
Frequency
yearly
Range
1947 \u2192 2025
Latest
2024
Employment-to-population ratio by sex and age by country
Latest available value per country (as of 2024)
Low \u2192 High
Unit: %
≤ 5.08%
5.08% – 8%
8% – 12.48%
12.48% – 19.88%
19.88% – 33.78%
33.78% – 50.3%
> 50.3%
No data
Generated by MacroVedia.comSource: International Labour Organization (ILO)
Highest 15 countries
Employment-to-population ratio by sex and age
50 countries with data
Generated by MacroVedia.comSource: International Labour Organization (ILO)
Distribution across countries
Employment-to-population ratio by sex and age
Countries
50
Median
54.4%
Mean
56.2%
25th pctl
43.6%
75th pctl
62.7%
Generated by MacroVedia.comSource: International Labour Organization (ILO)
Compare trends
Employment-to-population ratio by sex and age
BoliviaMoldovaGeorgia
Generated by MacroVedia.comSource: International Labour Organization (ILO)
| Country | Latest | Date | Trend |
|---|---|---|---|
| KazakhstanKAZ | 100% | 2022 | |
| Bahamas, TheBHS | 91.79% | 2023 | |
| MontserratMSR | 77.37% | 2011 | |
| NepalNPL | 76.4% | 2014 | |
| Faroe IslandsFRO | 75.59% | 2013 | |
| Isle of ManIMN | 74.37% | 2016 | |
| JerseyJEY | 73.84% | 2011 | |
| IndiaIND | 72.16% | 2023 | |
| QatarQAT | 69.67% | 2022 | |
| MozambiqueMOZ | 68.06% | 2022 | |
| ChinaCHN | 67.35% | 2019 | |
| BurundiBDI | 65.69% | 2020 | |
| TanzaniaTZA | 62.68% | 2024 | |
| St. Kitts and NevisKNA | 61.67% | 2001 | |
| NicaraguaNIC | 61.23% | 2013 | |
| AnguillaAIA | 60.8% | 2002 | |
| MoldovaMDA | 60.48% | 2024 | |
| NigeriaNGA | 59.27% | 2024 | |
| UzbekistanUZB | 58.9% | 2019 | |
| Turks and Caicos IslandsTCA | 58.72% | 2008 | |
| St. Vincent and the GrenadinesVCT | 58.5% | 2008 | |
| Northern Mariana IslandsMNP | 57.88% | 2010 | |
| BoliviaBOL | 55.55% | 2024 | |
| CubaCUB | 55.3% | 2013 | |
| Congo, Dem. Rep.COD | 54.68% | 2020 | |
| Solomon IslandsSLB | 54.07% | 2013 | |
| AngolaAGO | 53.34% | 2023 | |
| KenyaKEN | 53.19% | 2022 | |
| BeninBEN | 52.28% | 2022 | |
| GuamGUM | 51.4% | 2011 | |
| UgandaUGA | 50.54% | 2021 | |
| TogoTGO | 50.26% | 2022 | |
| American SamoaASM | 47.79% | 2010 | |
| NigerNER | 47.57% | 2022 | |
| Congo, Rep.COG | 47.22% | 2005 | — |
| CameroonCMR | 47.19% | 2021 | |
| ZambiaZMB | 46.62% | 2024 | |
| BermudaBMU | 43.64% | 2010 | |
| MalawiMWI | 42.64% | 2024 | |
| ChadTCD | 42.16% | 2018 | |
| GabonGAB | 41.52% | 2005 | |
| Timor-LesteTLS | 41.47% | 2022 | |
| Guinea-BissauGNB | 41.04% | 2022 | |
| GeorgiaGEO | 40.79% | 2024 | |
| MartiniqueMTQ | 40.59% | 2013 | |
| MadagascarMDG | 40.56% | 2022 | |
| GhanaGHA | 40.43% | 2024 | |
| TurkmenistanTKM | 40.27% | 1999 | — |
| ZimbabweZWE | 38.58% | 2024 | |
| HaitiHTI | 38.08% | 2012 |
Source: International Labour Organization (ILO)