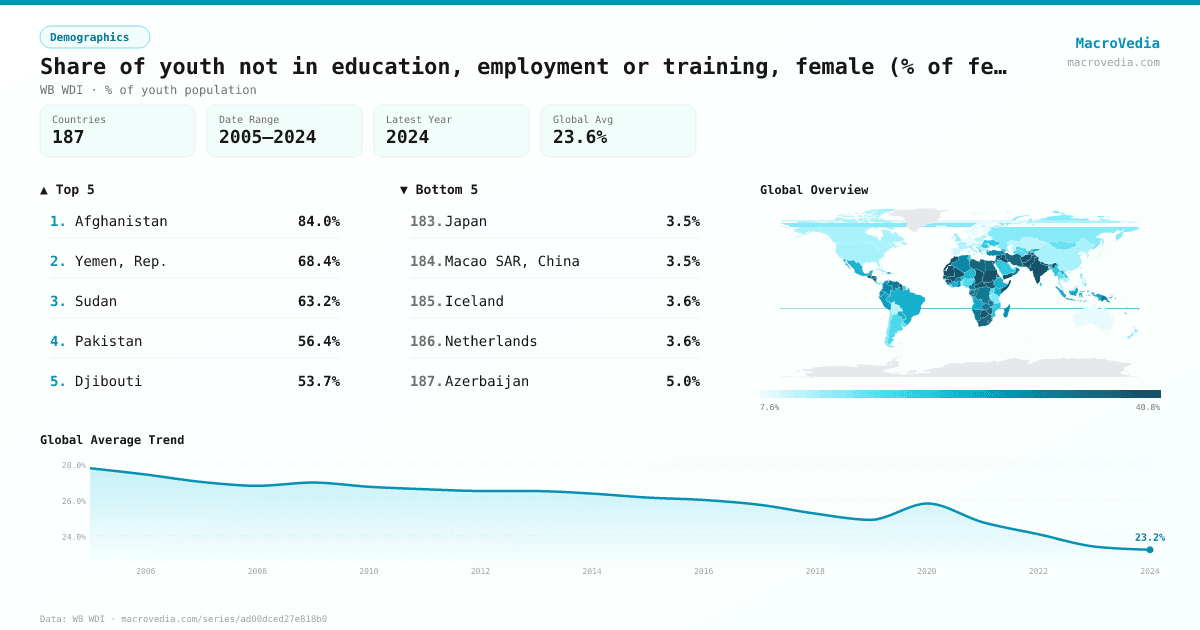
Share of youth not in education, employment or training, female (% of female youth population) (modeled ILO estimate)
DemographicsWB WDIwb_wdi:SL.UEM.NEET.FE.ME.ZS•% of youth population•2005 → 2024•187 countries
Series quick facts
High-level context for this country series.
DemographicsWB WDI
Coverage
187
Frequency
yearly
Range
2005 \u2192 2024
Latest
2024
Share of youth not in education, employment or training, female (% of female youth population) (modeled ILO estimate) by country
Latest available value per country (as of 2024)
Low \u2192 High
Unit: %
≤ 9.32%
9.32% – 13.2%
13.2% – 18.98%
18.98% – 24.63%
24.63% – 30.08%
30.08% – 37.88%
> 37.88%
No data
Generated by MacroVedia.comSource: World Bank (WB WDI)
Highest 15 countries
Share of youth not in education, employment or training, female (% of female youth population) (modeled ILO estimate)
50 countries with data
Generated by MacroVedia.comSource: World Bank (WB WDI)
Distribution across countries
Share of youth not in education, employment or training, female (% of female youth population) (modeled ILO estimate)
Countries
50
Median
38.5%
Mean
41.6%
25th pctl
33.2%
75th pctl
48.3%
Generated by MacroVedia.comSource: World Bank (WB WDI)
Compare trends
Share of youth not in education, employment or training, female (% of female youth population) (modeled ILO estimate)
AfghanistanYemen, Rep.Pakistan
Generated by MacroVedia.comSource: World Bank (WB WDI)
| Country | Latest | Date | Trend |
|---|---|---|---|
| AfghanistanAFG | 83.99% | 2024 | |
| Yemen, Rep.YEM | 68.41% | 2024 | |
| SudanSDN | 63.18% | 2022 | |
| PakistanPAK | 56.43% | 2024 | |
| DjiboutiDJI | 53.68% | 2024 | |
| TajikistanTJK | 53.15% | 2024 | |
| IraqIRQ | 53.13% | 2024 | |
| MoroccoMAR | 51.31% | 2024 | |
| Sao Tome and PrincipeSTP | 51.26% | 2024 | |
| Somalia, Fed. Rep.SOM | 50.16% | 2024 | |
| GuyanaGUY | 50.05% | 2024 | |
| ChadTCD | 49.15% | 2024 | |
| MauritaniaMRT | 48.33% | 2024 | |
| HondurasHND | 44.96% | 2024 | |
| SenegalSEN | 43.94% | 2024 | |
| LesothoLSO | 43.32% | 2024 | |
| Syrian Arab RepublicSYR | 42.73% | 2024 | |
| GuineaGIN | 42.58% | 2024 | |
| NepalNPL | 41.53% | 2024 | |
| GuatemalaGTM | 40.32% | 2024 | |
| MaliMLI | 39.84% | 2024 | |
| IndiaIND | 39.36% | 2024 | |
| EswatiniSWZ | 39.23% | 2024 | |
| VanuatuVUT | 38.92% | 2024 | |
| Gambia, TheGMB | 38.84% | 2024 | |
| BotswanaBWA | 38.21% | 2024 | |
| Central African RepublicCAF | 38.01% | 2024 | |
| South SudanSSD | 37.78% | 2023 | |
| NicaraguaNIC | 36.57% | 2024 | |
| ZimbabweZWE | 36.13% | 2024 | |
| LibyaLBY | 36.1% | 2024 | |
| Iran, Islamic Rep.IRN | 35.94% | 2024 | |
| South AfricaZAF | 35.61% | 2024 | |
| Egypt, Arab Rep.EGY | 35.5% | 2024 | |
| BelizeBLZ | 35.47% | 2024 | |
| JordanJOR | 34.57% | 2024 | |
| EritreaERI | 33.19% | 2024 | |
| NamibiaNAM | 33.18% | 2024 | |
| Sierra LeoneSLE | 33.12% | 2024 | |
| GabonGAB | 32.99% | 2024 | |
| Congo, Dem. Rep.COD | 32.77% | 2024 | |
| SamoaWSM | 32.55% | 2024 | |
| ZambiaZMB | 32.46% | 2024 | |
| Congo, Rep.COG | 32.46% | 2024 | |
| OmanOMN | 32.3% | 2024 | |
| El SalvadorSLV | 31.95% | 2024 | |
| Venezuela, RBVEN | 31.9% | 2024 | |
| Papua New GuineaPNG | 31.23% | 2024 | |
| CameroonCMR | 31.23% | 2024 | |
| Burkina FasoBFA | 31.12% | 2024 |
Source: World Bank (WB WDI)