Children in employment, wage workers, female (% of female children in employment, ages 7-
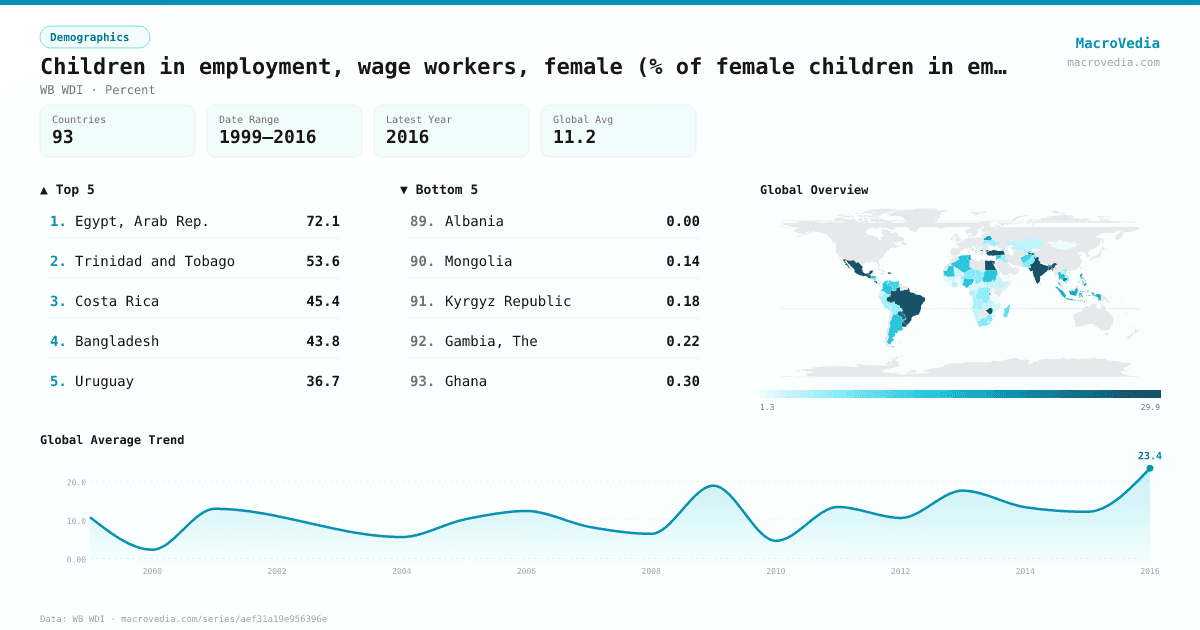
DemographicsWB WDIwb_wdi:SL.WAG.0714.FE.ZS•Percent•1999 → 2016•93 countries
Series quick facts
High-level context for this country series.
DemographicsWB WDI
Coverage
93
Frequency
—
Range
1999 \u2192 2016
Latest
2016
Children in employment, wage workers, female (% of female children in employment, ages 7- by country
Latest available value per country (as of 2016)
Low \u2192 High
Unit: %
≤ 2.22%
2.22% – 3.35%
3.35% – 5.33%
5.33% – 7.91%
7.91% – 13.56%
13.56% – 25.16%
> 25.16%
No data
Generated by MacroVedia.comSource: World Bank (WB WDI)
Highest 15 countries
Children in employment, wage workers, female (% of female children in employment, ages 7-
50 countries with data
Generated by MacroVedia.comSource: World Bank (WB WDI)
Distribution across countries
Children in employment, wage workers, female (% of female children in employment, ages 7-
Countries
50
Median
15.3%
Mean
19.7%
25th pctl
9.1%
75th pctl
25.2%
Generated by MacroVedia.comSource: World Bank (WB WDI)
Compare trends
Children in employment, wage workers, female (% of female children in employment, ages 7-
GuatemalaBrazilHonduras
Generated by MacroVedia.comSource: World Bank (WB WDI)
| Country | Latest | Date | Trend |
|---|---|---|---|
| Egypt, Arab Rep.EGY | 72.09% | 2009 | |
| Trinidad and TobagoTTO | 53.56% | 2006 | — |
| Costa RicaCRI | 45.4% | 2016 | |
| BangladeshBGD | 43.81% | 2013 | |
| UruguayURY | 36.73% | 2009 | — |
| MexicoMEX | 34.8% | 2013 | |
| TurkiyeTUR | 34.57% | 2006 | — |
| Dominican RepublicDOM | 32.73% | 2012 | |
| IndiaIND | 32.63% | 2012 | |
| ZimbabweZWE | 30% | 1999 | — |
| GuatemalaGTM | 29.59% | 2015 | |
| BrazilBRA | 28.8% | 2015 | |
| TajikistanTJK | 25.24% | 2005 | — |
| ParaguayPRY | 25.17% | 2014 | |
| Venezuela, RBVEN | 25.12% | 2006 | — |
| RwandaRWA | 25.04% | 2011 | |
| JordanJOR | 23.31% | 2007 | — |
| North MacedoniaMKD | 21.87% | 2011 | |
| CambodiaKHM | 20.44% | 2012 | |
| PhilippinesPHL | 17.2% | 2011 | |
| BelarusBLR | 17.13% | 2012 | |
| JamaicaJAM | 16.64% | 2011 | |
| HondurasHND | 16.11% | 2014 | |
| IndonesiaIDN | 15.66% | 2010 | — |
| TunisiaTUN | 15.54% | 2012 | — |
| ThailandTHA | 15.04% | 2006 | |
| NigeriaNGA | 13.57% | 2011 | |
| SudanSDN | 13.53% | 2008 | — |
| ArgentinaARG | 13.34% | 2012 | |
| ColombiaCOL | 13.3% | 2015 | |
| AlgeriaDZA | 13% | 2013 | — |
| MauritaniaMRT | 12.98% | 2011 | |
| EswatiniSWZ | 12.92% | 2010 | — |
| Syrian Arab RepublicSYR | 12.48% | 2006 | — |
| AfghanistanAFG | 11.77% | 2011 | — |
| El SalvadorSLV | 10.63% | 2013 | |
| PanamaPAN | 10.32% | 2012 | |
| CameroonCMR | 9.11% | 2007 | — |
| MadagascarMDG | 8.96% | 2007 | — |
| NicaraguaNIC | 7.99% | 2012 | |
| EcuadorECU | 7.8% | 2011 | — |
| MalawiMWI | 7.38% | 2006 | — |
| PakistanPAK | 7.31% | 2011 | — |
| Viet NamVNM | 7.26% | 2012 | |
| South AfricaZAF | 6.89% | 1999 | — |
| GhanaGHA | 6.82% | 2006 | — |
| NigerNER | 6.67% | 2012 | |
| ChadTCD | 6.55% | 2010 | |
| Congo, Dem. Rep.COD | 6.2% | 2010 | — |
| MaliMLI | 6.15% | 2007 | — |
Source: World Bank (WB WDI)