Probability of dying among adolescents ages 15-19 years (per 1,
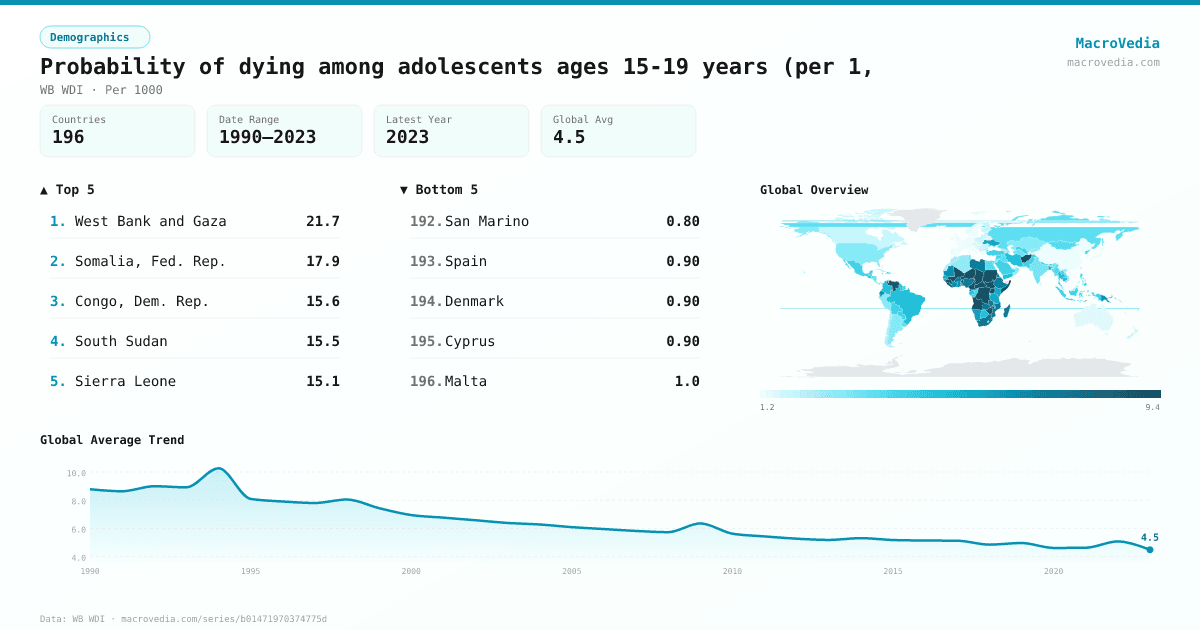
DemographicsWB WDIwb_wdi:SH.DYN.1519•Per 1000•1990 → 2023•196 countries
Series quick facts
High-level context for this country series.
DemographicsWB WDI
Coverage
196
Frequency
yearly
Range
1990 \u2192 2023
Latest
2023
Probability of dying among adolescents ages 15-19 years (per 1, by country
Latest available value per country (as of 2023)
Low \u2192 High
Unit: Per 1000
≤ 1.3
1.3 – 2.1
2.1 – 3.06
3.06 – 4.04
4.04 – 5.13
5.13 – 7.51
> 7.51
No data
Generated by MacroVedia.comSource: World Bank (WB WDI)
Highest 15 countries
Probability of dying among adolescents ages 15-19 years (per 1,
50 countries with data
Generated by MacroVedia.comSource: World Bank (WB WDI)
Distribution across countries
Probability of dying among adolescents ages 15-19 years (per 1,
Countries
50
Median
7.6
Mean
11.9
25th pctl
6.7
75th pctl
11.5
Generated by MacroVedia.comSource: World Bank (WB WDI)
Compare trends
Probability of dying among adolescents ages 15-19 years (per 1,
West Bank and GazaSomalia, Fed. Rep.Congo, Dem. Rep.
Generated by MacroVedia.comSource: World Bank (WB WDI)
| Country | Latest | Date | Trend |
|---|---|---|---|
| Central African RepublicCAF | 136.6 Per 1000 | 2022 | |
| West Bank and GazaPSE | 21.7 Per 1000 | 2023 | |
| Somalia, Fed. Rep.SOM | 17.9 Per 1000 | 2023 | |
| Congo, Dem. Rep.COD | 15.6 Per 1000 | 2023 | |
| South SudanSSD | 15.5 Per 1000 | 2023 | |
| Sierra LeoneSLE | 15.1 Per 1000 | 2023 | |
| Timor-LesteTLS | 14.3 Per 1000 | 2023 | |
| ChadTCD | 13.9 Per 1000 | 2023 | |
| GuineaGIN | 12.2 Per 1000 | 2023 | |
| UgandaUGA | 12.1 Per 1000 | 2023 | |
| AfghanistanAFG | 11.8 Per 1000 | 2023 | |
| AngolaAGO | 11.5 Per 1000 | 2023 | |
| LiberiaLBR | 11.5 Per 1000 | 2023 | |
| CameroonCMR | 10.8 Per 1000 | 2023 | |
| SudanSDN | 10.7 Per 1000 | 2023 | |
| BeninBEN | 10.2 Per 1000 | 2023 | |
| Equatorial GuineaGNQ | 10.2 Per 1000 | 2023 | |
| Guinea-BissauGNB | 10.1 Per 1000 | 2023 | |
| DjiboutiDJI | 9.7 Per 1000 | 2023 | |
| MaliMLI | 9.5 Per 1000 | 2023 | |
| NigerNER | 9.3 Per 1000 | 2023 | |
| Venezuela, RBVEN | 8.8 Per 1000 | 2023 | |
| ZimbabweZWE | 8.8 Per 1000 | 2023 | |
| EswatiniSWZ | 8.6 Per 1000 | 2023 | |
| EritreaERI | 7.6 Per 1000 | 2023 | |
| MozambiqueMOZ | 7.6 Per 1000 | 2023 | |
| South AfricaZAF | 7.6 Per 1000 | 2023 | |
| ZambiaZMB | 7.6 Per 1000 | 2023 | |
| KiribatiKIR | 7.5 Per 1000 | 2023 | |
| MadagascarMDG | 7.5 Per 1000 | 2023 | |
| BurundiBDI | 7.4 Per 1000 | 2023 | |
| Gambia, TheGMB | 7.4 Per 1000 | 2023 | |
| Burkina FasoBFA | 7.1 Per 1000 | 2023 | |
| LibyaLBY | 7.1 Per 1000 | 2023 | |
| NigeriaNGA | 7.1 Per 1000 | 2023 | |
| PalauPLW | 7.1 Per 1000 | 2023 | |
| EthiopiaETH | 7 Per 1000 | 2023 | |
| Cote d'IvoireCIV | 6.7 Per 1000 | 2023 | |
| GhanaGHA | 6.7 Per 1000 | 2023 | |
| TogoTGO | 6.7 Per 1000 | 2023 | |
| MalawiMWI | 6.5 Per 1000 | 2023 | |
| HaitiHTI | 6.4 Per 1000 | 2023 | |
| MauritaniaMRT | 6.4 Per 1000 | 2023 | |
| EcuadorECU | 6.3 Per 1000 | 2023 | |
| Papua New GuineaPNG | 6.3 Per 1000 | 2023 | |
| NamibiaNAM | 6.1 Per 1000 | 2023 | |
| St. Kitts and NevisKNA | 5.8 Per 1000 | 2023 | |
| SenegalSEN | 5.8 Per 1000 | 2023 | |
| UkraineUKR | 5.8 Per 1000 | 2023 | |
| TanzaniaTZA | 5.7 Per 1000 | 2023 |
Source: World Bank (WB WDI)