Mortality rate, under-5, female (per 1,000 live births)
DemographicsWB WDIwb_wdi:SH.DYN.MORT.FE•Per 1000 live births•1960 → 2023•196 countries
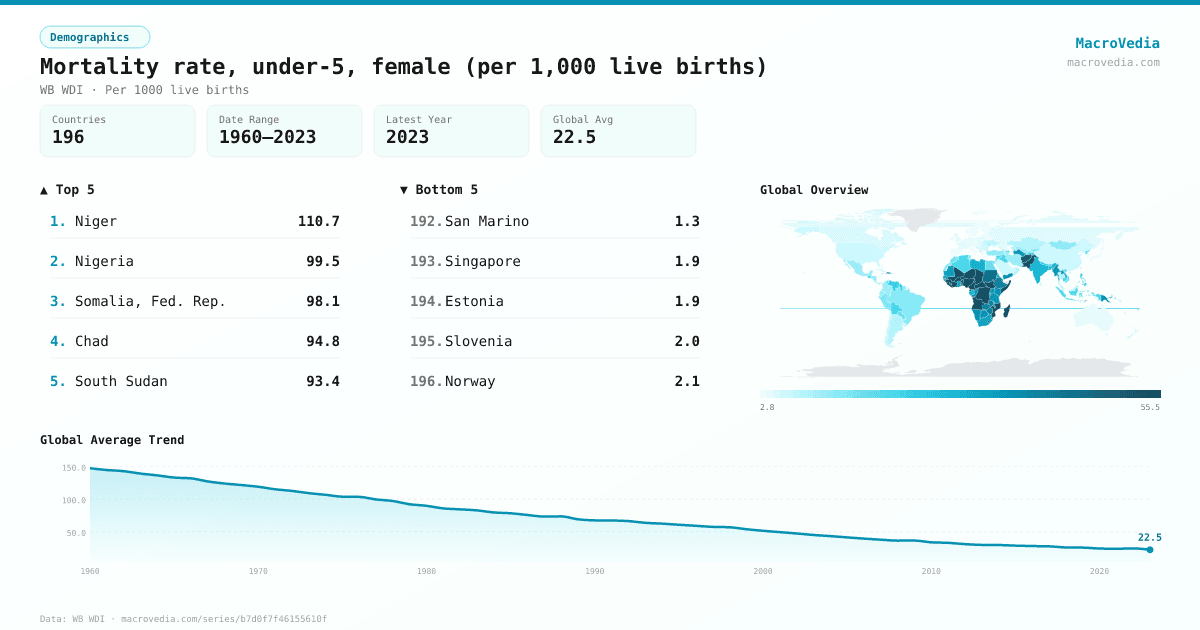
Series quick facts
High-level context for this country series.
DemographicsWB WDI
Coverage
196
Frequency
yearly
Range
1960 \u2192 2023
Latest
2023
Mortality rate, under-5, female (per 1,000 live births) by country
Latest available value per country (as of 2023)
Low \u2192 High
Unit: Per 1000 live births
≤ 3.4
3.4 – 6.43
6.43 – 11.51
11.51 – 16.74
16.74 – 29.51
29.51 – 45.07
> 45.07
No data
Generated by MacroVedia.comSource: World Bank (WB WDI)
Highest 15 countries
Mortality rate, under-5, female (per 1,000 live births)
50 countries with data
Generated by MacroVedia.comSource: World Bank (WB WDI)
Distribution across countries
Mortality rate, under-5, female (per 1,000 live births)
Countries
50
Median
50.2
Mean
61.4
25th pctl
36.8
75th pctl
66.3
Generated by MacroVedia.comSource: World Bank (WB WDI)
Compare trends
Mortality rate, under-5, female (per 1,000 live births)
ChadSouth SudanSierra Leone
Generated by MacroVedia.comSource: World Bank (WB WDI)
| Country | Latest | Date | Trend |
|---|---|---|---|
| Central African RepublicCAF | 381.2 Per 1000 live births | 2022 | |
| NigerNER | 110.7 Per 1000 live births | 2023 | |
| NigeriaNGA | 99.5 Per 1000 live births | 2023 | |
| Somalia, Fed. Rep.SOM | 98.1 Per 1000 live births | 2023 | |
| ChadTCD | 94.8 Per 1000 live births | 2023 | |
| South SudanSSD | 93.4 Per 1000 live births | 2023 | |
| Sierra LeoneSLE | 88.4 Per 1000 live births | 2023 | |
| GuineaGIN | 87.7 Per 1000 live births | 2023 | |
| MaliMLI | 86.1 Per 1000 live births | 2023 | |
| Burkina FasoBFA | 72.7 Per 1000 live births | 2023 | |
| BeninBEN | 72.4 Per 1000 live births | 2023 | |
| Congo, Dem. Rep.COD | 67.6 Per 1000 live births | 2023 | |
| LiberiaLBR | 66.3 Per 1000 live births | 2023 | |
| Equatorial GuineaGNQ | 65.1 Per 1000 live births | 2023 | |
| Guinea-BissauGNB | 63.4 Per 1000 live births | 2023 | |
| CameroonCMR | 61.9 Per 1000 live births | 2023 | |
| Cote d'IvoireCIV | 59.7 Per 1000 live births | 2023 | |
| MadagascarMDG | 59.5 Per 1000 live births | 2023 | |
| AngolaAGO | 58.8 Per 1000 live births | 2023 | |
| MozambiqueMOZ | 57.1 Per 1000 live births | 2023 | |
| PakistanPAK | 53.8 Per 1000 live births | 2023 | |
| TogoTGO | 53.7 Per 1000 live births | 2023 | |
| LesothoLSO | 52.8 Per 1000 live births | 2023 | |
| AfghanistanAFG | 51.6 Per 1000 live births | 2023 | |
| KiribatiKIR | 50.5 Per 1000 live births | 2023 | |
| HaitiHTI | 49.8 Per 1000 live births | 2023 | |
| Timor-LesteTLS | 45.8 Per 1000 live births | 2023 | |
| DjiboutiDJI | 45.5 Per 1000 live births | 2023 | |
| BurundiBDI | 45 Per 1000 live births | 2023 | |
| SudanSDN | 45 Per 1000 live births | 2023 | |
| ZambiaZMB | 40.5 Per 1000 live births | 2023 | |
| EthiopiaETH | 40.3 Per 1000 live births | 2023 | |
| EswatiniSWZ | 40.2 Per 1000 live births | 2023 | |
| ZimbabweZWE | 39.3 Per 1000 live births | 2023 | |
| Gambia, TheGMB | 39.2 Per 1000 live births | 2023 | |
| ComorosCOM | 37.2 Per 1000 live births | 2023 | |
| Papua New GuineaPNG | 37 Per 1000 live births | 2023 | |
| Congo, Rep.COG | 36.8 Per 1000 live births | 2023 | |
| NamibiaNAM | 36.6 Per 1000 live births | 2023 | |
| RwandaRWA | 36.1 Per 1000 live births | 2023 | |
| KenyaKEN | 35.6 Per 1000 live births | 2023 | |
| Yemen, Rep.YEM | 35.5 Per 1000 live births | 2023 | |
| BotswanaBWA | 35.3 Per 1000 live births | 2023 | |
| TanzaniaTZA | 35 Per 1000 live births | 2023 | |
| TurkmenistanTKM | 34.7 Per 1000 live births | 2023 | |
| MyanmarMMR | 34.6 Per 1000 live births | 2023 | |
| UgandaUGA | 34.6 Per 1000 live births | 2023 | |
| Lao PDRLAO | 34.5 Per 1000 live births | 2023 | |
| SenegalSEN | 34.1 Per 1000 live births | 2023 | |
| MalawiMWI | 34 Per 1000 live births | 2023 |
Source: World Bank (WB WDI)