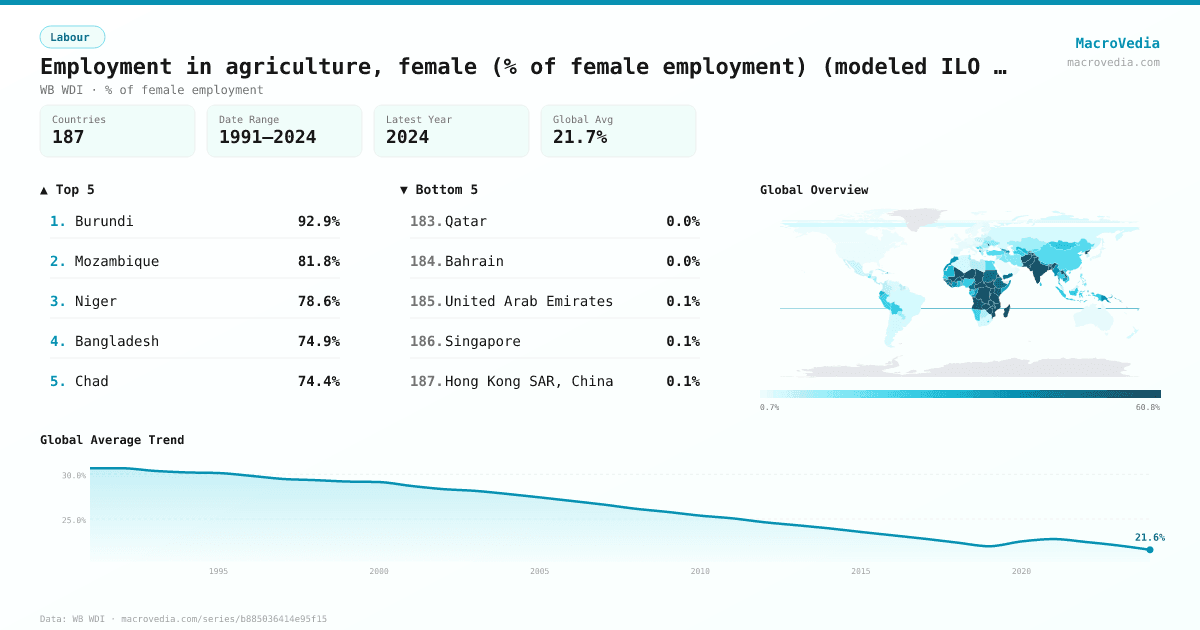
Employment in agriculture, female (% of female employment) (modeled ILO estimate)
LabourWB WDIwb_wdi:SL.AGR.EMPL.FE.ZS•% of female employment•1991 → 2024•187 countries
Series quick facts
High-level context for this country series.
LabourWB WDI
Coverage
187
Frequency
yearly
Range
1991 \u2192 2024
Latest
2024
Employment in agriculture, female (% of female employment) (modeled ILO estimate) by country
Latest available value per country (as of 2024)
Low \u2192 High
Unit: %
≤ 0.98%
0.98% – 2.81%
2.81% – 6.54%
6.54% – 17.99%
17.99% – 34.5%
34.5% – 52.99%
> 52.99%
No data
Generated by MacroVedia.comSource: World Bank (WB WDI)
Highest 15 countries
Employment in agriculture, female (% of female employment) (modeled ILO estimate)
50 countries with data
Generated by MacroVedia.comSource: World Bank (WB WDI)
Distribution across countries
Employment in agriculture, female (% of female employment) (modeled ILO estimate)
Countries
50
Median
55.2%
Mean
56.1%
25th pctl
44.8%
75th pctl
67.8%
Generated by MacroVedia.comSource: World Bank (WB WDI)
Compare trends
Employment in agriculture, female (% of female employment) (modeled ILO estimate)
BurundiMozambiqueNiger
Generated by MacroVedia.comSource: World Bank (WB WDI)
| Country | Latest | Date | Trend |
|---|---|---|---|
| BurundiBDI | 92.93% | 2024 | |
| MozambiqueMOZ | 81.85% | 2024 | |
| NigerNER | 78.57% | 2024 | |
| BangladeshBGD | 74.95% | 2024 | |
| ChadTCD | 74.4% | 2024 | |
| AfghanistanAFG | 73.89% | 2024 | |
| MalawiMWI | 71.4% | 2024 | |
| UgandaUGA | 71.33% | 2024 | |
| Lao PDRLAO | 68.77% | 2024 | |
| MadagascarMDG | 68.58% | 2024 | |
| Central African RepublicCAF | 68.38% | 2024 | |
| PakistanPAK | 68.21% | 2024 | |
| Congo, Dem. Rep.COD | 67.75% | 2024 | |
| TanzaniaTZA | 67.27% | 2024 | |
| Guinea-BissauGNB | 66.77% | 2024 | |
| South SudanSSD | 65.42% | 2023 | |
| TajikistanTJK | 62.17% | 2024 | |
| ZimbabweZWE | 62.04% | 2024 | |
| MaliMLI | 61.36% | 2024 | |
| IndiaIND | 60.5% | 2024 | |
| ZambiaZMB | 58.81% | 2024 | |
| EritreaERI | 58.64% | 2024 | |
| Korea, Dem. People's Rep.PRK | 57.95% | 2024 | |
| AngolaAGO | 56.25% | 2024 | |
| Equatorial GuineaGNQ | 56.09% | 2024 | |
| Burkina FasoBFA | 54.22% | 2024 | |
| KenyaKEN | 54.1% | 2024 | |
| BhutanBTN | 52.16% | 2024 | |
| MoldovaMDA | 51.74% | 2024 | |
| EthiopiaETH | 51.08% | 2024 | |
| SudanSDN | 50.2% | 2022 | |
| GuineaGIN | 49.3% | 2024 | |
| Timor-LesteTLS | 47.26% | 2024 | |
| VanuatuVUT | 46.52% | 2024 | |
| CameroonCMR | 45.37% | 2024 | |
| LiberiaLBR | 45.12% | 2024 | |
| RwandaRWA | 44.8% | 2024 | |
| Yemen, Rep.YEM | 44.79% | 2024 | |
| Sierra LeoneSLE | 44.56% | 2024 | |
| Solomon IslandsSLB | 44.12% | 2024 | |
| Cote d'IvoireCIV | 41.92% | 2024 | |
| Gambia, TheGMB | 39.81% | 2024 | |
| Papua New GuineaPNG | 39.54% | 2024 | |
| MoroccoMAR | 39.3% | 2024 | |
| AzerbaijanAZE | 39.23% | 2024 | |
| MyanmarMMR | 38.44% | 2024 | |
| Congo, Rep.COG | 38.03% | 2024 | |
| GeorgiaGEO | 37.19% | 2024 | |
| NepalNPL | 36.78% | 2024 | |
| AlbaniaALB | 36.45% | 2024 |
Source: World Bank (WB WDI)