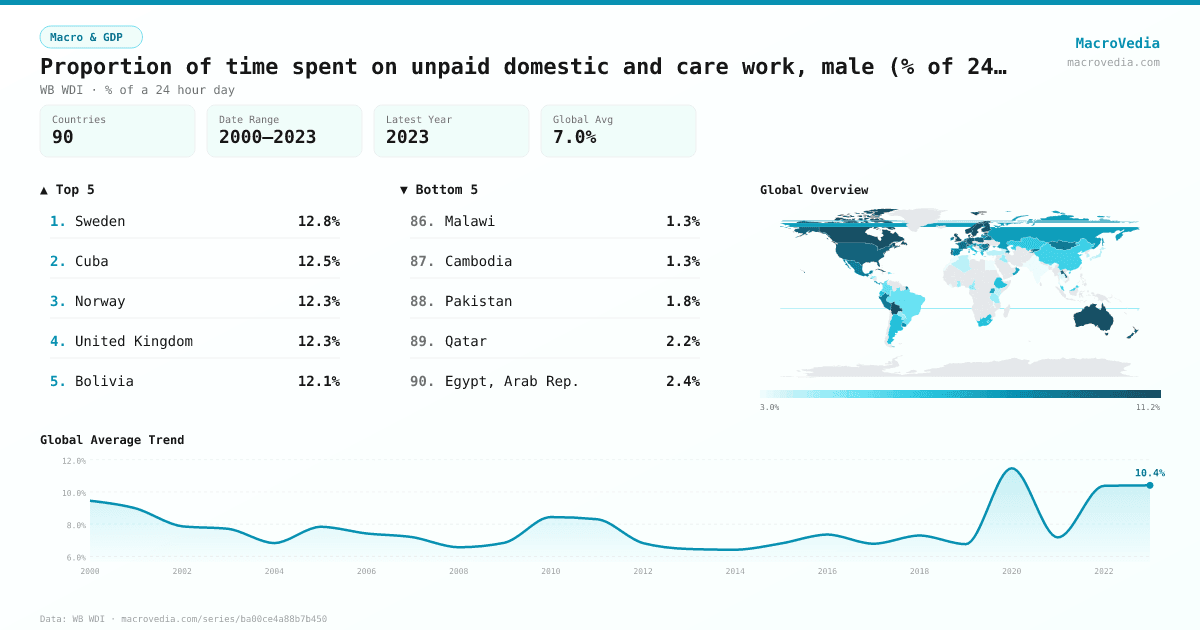
Proportion of time spent on unpaid domestic and care work, male (% of 24 hour day)
Macro & GDPWB WDIwb_wdi:SG.TIM.UWRK.MA•% of a 24 hour day•2000 → 2023•90 countries
Series quick facts
High-level context for this country series.
Macro & GDPWB WDI
Coverage
90
Frequency
—
Range
2000 \u2192 2023
Latest
2023
Proportion of time spent on unpaid domestic and care work, male (% of 24 hour day) by country
Latest available value per country (as of 2023)
Low \u2192 High
Unit: %
≤ 3.43%
3.43% – 4.57%
4.57% – 6.48%
6.48% – 7.95%
7.95% – 9.22%
9.22% – 10.55%
> 10.55%
No data
Generated by MacroVedia.comSource: World Bank (WB WDI)
Highest 15 countries
Proportion of time spent on unpaid domestic and care work, male (% of 24 hour day)
50 countries with data
Generated by MacroVedia.comSource: World Bank (WB WDI)
Distribution across countries
Proportion of time spent on unpaid domestic and care work, male (% of 24 hour day)
Countries
50
Median
9.2%
Mean
9.4%
25th pctl
8.3%
75th pctl
10.6%
Generated by MacroVedia.comSource: World Bank (WB WDI)
Compare trends
Proportion of time spent on unpaid domestic and care work, male (% of 24 hour day)
United StatesSwitzerlandMongolia
Generated by MacroVedia.comSource: World Bank (WB WDI)
| Country | Latest | Date | Trend |
|---|---|---|---|
| SwedenSWE | 12.83% | 2011 | |
| CubaCUB | 12.47% | 2016 | |
| NorwayNOR | 12.33% | 2011 | |
| United KingdomGBR | 12.25% | 2022 | |
| BoliviaBOL | 12.13% | 2001 | — |
| CanadaCAN | 11.63% | 2023 | |
| SwitzerlandCHE | 11.47% | 2020 | |
| MoldovaMDA | 11.27% | 2012 | — |
| DenmarkDNK | 11.25% | 2009 | |
| AustraliaAUS | 11.18% | 2021 | |
| SloveniaSVN | 11.11% | 2001 | — |
| FinlandFIN | 10.75% | 2021 | |
| New ZealandNZL | 10.56% | 2010 | — |
| GermanyDEU | 10.54% | 2022 | |
| BelgiumBEL | 10.34% | 2014 | |
| EstoniaEST | 10.33% | 2021 | |
| PortugalPRT | 10.24% | 2015 | — |
| United StatesUSA | 10.08% | 2022 | |
| Lao PDRLAO | 10.06% | 2017 | |
| PolandPOL | 9.93% | 2013 | |
| BelarusBLR | 9.51% | 2015 | — |
| Kyrgyz RepublicKGZ | 9.51% | 2015 | |
| FranceFRA | 9.49% | 2010 | — |
| RomaniaROU | 9.38% | 2012 | |
| BulgariaBGR | 9.24% | 2010 | |
| NetherlandsNLD | 9.24% | 2012 | |
| MongoliaMNG | 9.19% | 2023 | |
| LatviaLVA | 9.1% | 2003 | — |
| IrelandIRL | 8.96% | 2005 | — |
| PeruPER | 8.95% | 2010 | — |
| AzerbaijanAZE | 8.89% | 2008 | — |
| MexicoMEX | 8.82% | 2019 | |
| SerbiaSRB | 8.69% | 2015 | |
| AustriaAUT | 8.63% | 2022 | |
| SpainESP | 8.61% | 2010 | |
| Costa RicaCRI | 8.38% | 2017 | — |
| UruguayURY | 8.38% | 2013 | |
| LithuaniaLTU | 8.33% | 2003 | — |
| HungaryHUN | 7.98% | 2010 | |
| Russian FederationRUS | 7.8% | 2019 | — |
| PanamaPAN | 7.57% | 2011 | — |
| OmanOMN | 7.5% | 2008 | |
| UgandaUGA | 7.5% | 2018 | — |
| LuxembourgLUX | 7.08% | 2014 | — |
| El SalvadorSLV | 7.03% | 2017 | |
| GreeceGRC | 7.01% | 2014 | — |
| MaltaMLT | 7.01% | 2002 | — |
| ItalyITA | 6.79% | 2014 | |
| ArgentinaARG | 6.6% | 2010 | |
| EthiopiaETH | 6.6% | 2013 | — |
Source: World Bank (WB WDI)