Net acquisition of financial assets (% of GDP)
Macro & GDPWB WDIwb_wdi:GC.AST.TOTL.GD.ZS•%•1970 → 2024•150 countries
Series quick facts
High-level context for this country series.
Macro & GDPWB WDI
Coverage
150
Frequency
yearly
Range
1970 \u2192 2024
Latest
2024
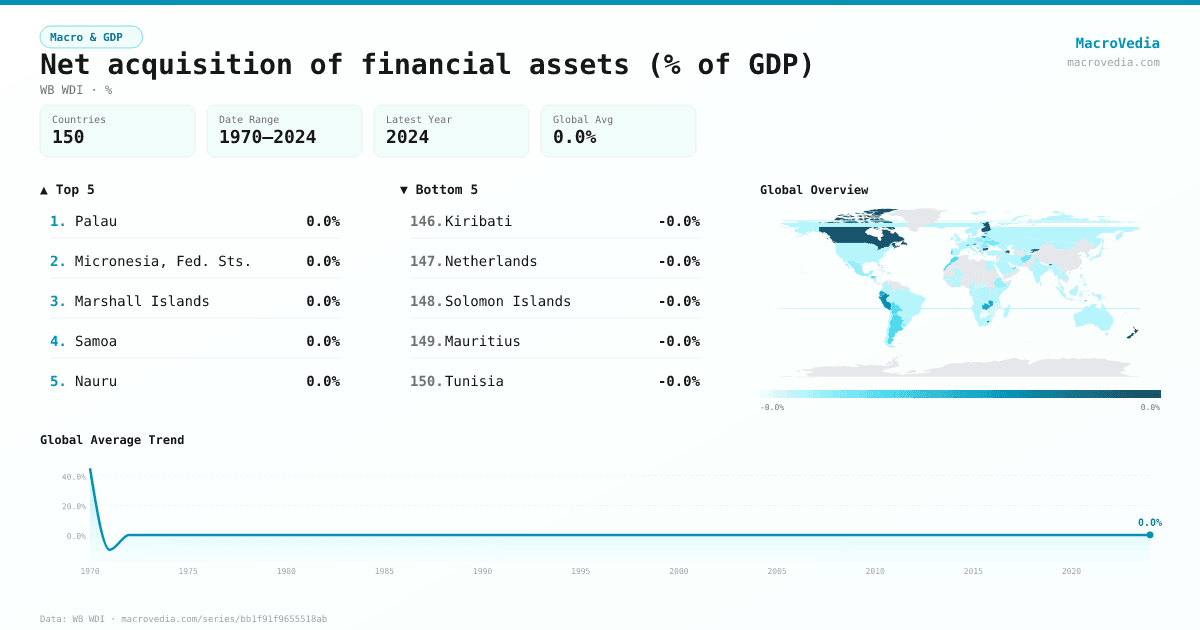
Net acquisition of financial assets (% of GDP) by country
Latest available value per country (as of 2024)
Low \u2192 High
Unit: %
≤ -0%
-0% – -0%
-0% – 0%
0% – 0%
0% – 0%
0% – 0%
> 0%
No data
Generated by MacroVedia.comSource: World Bank (WB WDI)
Highest 15 countries
Net acquisition of financial assets (% of GDP)
50 countries with data
Generated by MacroVedia.comSource: World Bank (WB WDI)
Distribution across countries
Net acquisition of financial assets (% of GDP)
Countries
50
Median
0%
Mean
0%
25th pctl
0%
75th pctl
0%
Generated by MacroVedia.comSource: World Bank (WB WDI)
Compare trends
Net acquisition of financial assets (% of GDP)
SingaporeCanadaLesotho
Generated by MacroVedia.comSource: World Bank (WB WDI)
| Country | Latest | Date | Trend |
|---|---|---|---|
| Micronesia, Fed. Sts.FSM | 0.02% | 2019 | |
| PalauPLW | 0.01% | 2020 | |
| Marshall IslandsMHL | 0% | 2020 | |
| SamoaWSM | 0% | 2022 | |
| NauruNRU | 0% | 2020 | |
| San MarinoSMR | 0% | 2006 | |
| AzerbaijanAZE | 0% | 2022 | |
| SingaporeSGP | 0% | 2024 | |
| LithuaniaLTU | 0% | 1993 | — |
| BahrainBHR | 0% | 2013 | |
| Timor-LesteTLS | 0% | 2022 | |
| SeychellesSYC | 0% | 2008 | |
| MaldivesMDV | 0% | 2021 | |
| TongaTON | 0% | 2023 | |
| New ZealandNZL | 0% | 2008 | |
| BulgariaBGR | 0% | 1994 | |
| FinlandFIN | 0% | 1994 | |
| BarbadosBRB | 0% | 2015 | |
| CanadaCAN | 0% | 2024 | |
| LesothoLSO | 0% | 2024 | |
| BhutanBTN | 0% | 2020 | |
| EcuadorECU | 0% | 2021 | |
| NamibiaNAM | 0% | 2022 | |
| Bahamas, TheBHS | 0% | 2023 | |
| Kyrgyz RepublicKGZ | 0% | 2024 | |
| EstoniaEST | 0% | 1991 | — |
| PeruPER | 0% | 2021 | |
| FijiFJI | 0% | 2022 | |
| BelizeBLZ | 0% | 2010 | |
| Macao SAR, ChinaMAC | 0% | 2023 | |
| ZambiaZMB | 0% | 2021 | |
| UruguayURY | 0% | 2023 | |
| BoliviaBOL | 0% | 2006 | |
| St. Vincent and the GrenadinesVCT | 0% | 2009 | |
| SwitzerlandCHE | 0% | 2023 | |
| AustriaAUT | 0% | 1994 | |
| Cabo VerdeCPV | 0% | 2019 | |
| AlbaniaALB | 0% | 2023 | |
| HondurasHND | 0% | 2015 | |
| United Arab EmiratesARE | 0% | 2024 | |
| PortugalPRT | 0% | 1994 | |
| ArgentinaARG | 0% | 2023 | |
| MoroccoMAR | 0% | 2023 | |
| VanuatuVUT | 0% | 2023 | |
| RomaniaROU | 0% | 1993 | |
| EthiopiaETH | 0% | 2023 | |
| AfghanistanAFG | 0% | 2017 | |
| AndorraAND | 0% | 2022 | |
| UkraineUKR | 0% | 2024 | |
| Bosnia and HerzegovinaBIH | 0% | 2024 |
Source: World Bank (WB WDI)