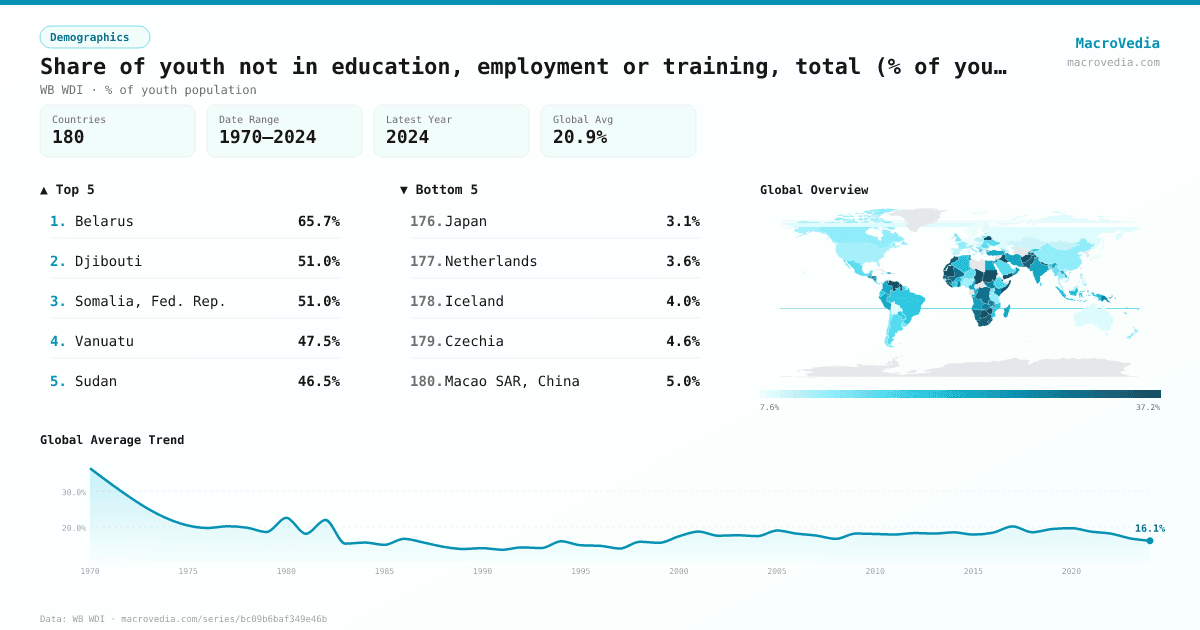
Share of youth not in education, employment or training, total (% of youth population)
DemographicsWB WDIwb_wdi:SL.UEM.NEET.ZS•% of youth population•1970 → 2024•180 countries
Series quick facts
High-level context for this country series.
DemographicsWB WDI
Coverage
180
Frequency
yearly
Range
1970 \u2192 2024
Latest
2024
Share of youth not in education, employment or training, total (% of youth population) by country
Latest available value per country (as of 2024)
Low \u2192 High
Unit: %
≤ 8.85%
8.85% – 12.82%
12.82% – 17.23%
17.23% – 21.44%
21.44% – 26.66%
26.66% – 35.33%
> 35.33%
No data
Generated by MacroVedia.comSource: World Bank (WB WDI)
Highest 15 countries
Share of youth not in education, employment or training, total (% of youth population)
50 countries with data
Generated by MacroVedia.comSource: World Bank (WB WDI)
Distribution across countries
Share of youth not in education, employment or training, total (% of youth population)
Countries
50
Median
35.7%
Mean
37.4%
25th pctl
31.2%
75th pctl
41.3%
Generated by MacroVedia.comSource: World Bank (WB WDI)
Compare trends
Share of youth not in education, employment or training, total (% of youth population)
South AfricaHondurasPakistan
Generated by MacroVedia.comSource: World Bank (WB WDI)
| Country | Latest | Date | Trend |
|---|---|---|---|
| BelarusBLR | 65.73% | 2024 | |
| Solomon IslandsSLB | 53.47% | 1999 | — |
| DjiboutiDJI | 51.03% | 2017 | — |
| Somalia, Fed. Rep.SOM | 50.95% | 2022 | |
| VanuatuVUT | 47.53% | 2020 | |
| SudanSDN | 46.53% | 2022 | |
| GuyanaGUY | 45.66% | 2019 | |
| Yemen, Rep.YEM | 44.77% | 2014 | — |
| MauritaniaMRT | 44.09% | 2019 | |
| HaitiHTI | 43.89% | 2003 | — |
| Sao Tome and PrincipeSTP | 43.8% | 2017 | — |
| AfghanistanAFG | 43.77% | 2021 | |
| TajikistanTJK | 41.33% | 2016 | |
| NauruNRU | 40.99% | 2021 | |
| Marshall IslandsMHL | 39.97% | 2021 | |
| LiberiaLBR | 39.94% | 2017 | |
| Gambia, TheGMB | 39.85% | 2023 | |
| MalawiMWI | 39.42% | 2024 | |
| BotswanaBWA | 38% | 2024 | |
| LesothoLSO | 37.98% | 2024 | |
| Venezuela, RBVEN | 37.13% | 2020 | |
| ChadTCD | 37.05% | 2018 | — |
| IraqIRQ | 36.93% | 2021 | |
| EswatiniSWZ | 36.47% | 2023 | |
| ZimbabweZWE | 35.99% | 2024 | |
| KiribatiKIR | 35.41% | 2023 | |
| MoroccoMAR | 35.28% | 2014 | — |
| SenegalSEN | 35.17% | 2024 | |
| NepalNPL | 34.76% | 2017 | |
| South AfricaZAF | 34.61% | 2024 | |
| PakistanPAK | 34.56% | 2021 | |
| TuvaluTUV | 34.35% | 2022 | |
| GuineaGIN | 34.3% | 2019 | |
| Sierra LeoneSLE | 33.17% | 2018 | |
| NamibiaNAM | 31.88% | 2018 | |
| Congo, Dem. Rep.COD | 31.37% | 2020 | |
| MaliMLI | 31.34% | 2023 | |
| Guinea-BissauGNB | 31.16% | 2019 | |
| HondurasHND | 30.75% | 2024 | |
| JordanJOR | 30.23% | 2023 | |
| SamoaWSM | 30.09% | 2022 | |
| KosovoXKX | 30.04% | 2024 | |
| Timor-LesteTLS | 29.12% | 2022 | |
| South SudanSSD | 29.06% | 2008 | — |
| BarbadosBRB | 28.99% | 2016 | — |
| ZambiaZMB | 28.93% | 2023 | |
| Micronesia, Fed. Sts.FSM | 28.67% | 2014 | — |
| Cabo VerdeCPV | 27.99% | 2019 | |
| KenyaKEN | 27.79% | 2022 | |
| Papua New GuineaPNG | 27.69% | 2022 |
Source: World Bank (WB WDI)