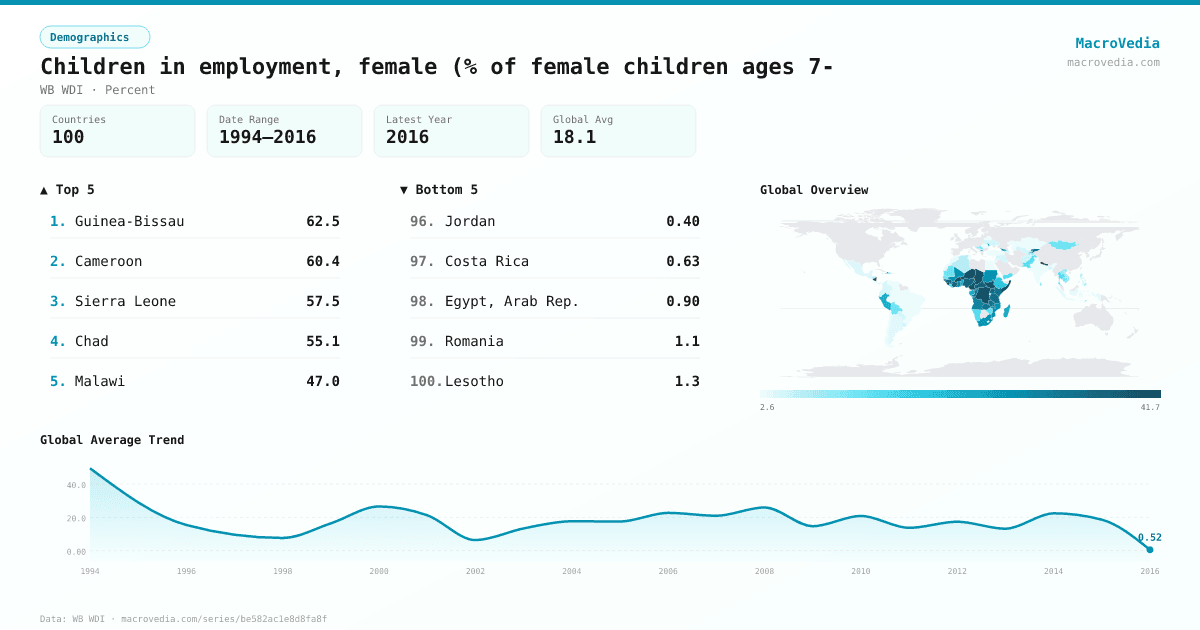
Children in employment, female (% of female children ages 7-
DemographicsWB WDIwb_wdi:SL.TLF.0714.FE.ZS•Percent•1994 → 2016•100 countries
Series quick facts
High-level context for this country series.
DemographicsWB WDI
Coverage
100
Frequency
—
Range
1994 \u2192 2016
Latest
2015
Children in employment, female (% of female children ages 7- by country
Latest available value per country (as of 2015)
Low \u2192 High
Unit: %
≤ 4.23%
4.23% – 6.28%
6.28% – 12.79%
12.79% – 20.37%
20.37% – 32.17%
32.17% – 41.14%
> 41.14%
No data
Generated by MacroVedia.comSource: World Bank (WB WDI)
Highest 15 countries
Children in employment, female (% of female children ages 7-
50 countries with data
Generated by MacroVedia.comSource: World Bank (WB WDI)
Distribution across countries
Children in employment, female (% of female children ages 7-
Countries
50
Median
33.8%
Mean
35.4%
25th pctl
26.4%
75th pctl
44.1%
Generated by MacroVedia.comSource: World Bank (WB WDI)
Compare trends
Children in employment, female (% of female children ages 7-
Sierra LeoneMalawiPeru
Generated by MacroVedia.comSource: World Bank (WB WDI)
| Country | Latest | Date | Trend |
|---|---|---|---|
| BeninBEN | 76.1% | 2006 | — |
| Central African RepublicCAF | 67.6% | 2000 | — |
| Guinea-BissauGNB | 62.46% | 2014 | |
| CameroonCMR | 60.4% | 2011 | |
| Sierra LeoneSLE | 57.5% | 2013 | |
| ChadTCD | 55.09% | 2015 | |
| GhanaGHA | 48% | 2006 | |
| EthiopiaETH | 47.1% | 2005 | — |
| MalawiMWI | 47% | 2015 | |
| NigerNER | 46.7% | 2012 | |
| South SudanSSD | 45.7% | 2008 | — |
| Burkina FasoBFA | 44.8% | 2010 | |
| NepalNPL | 44.09% | 2014 | |
| Congo, Dem. Rep.COD | 43.61% | 2014 | |
| Somalia, Fed. Rep.SOM | 41.5% | 2006 | — |
| NicaraguaNIC | 38.96% | 2012 | |
| LiberiaLBR | 37.1% | 2007 | — |
| Cote d'IvoireCIV | 36.4% | 2012 | |
| UgandaUGA | 36.3% | 2012 | |
| NigeriaNGA | 36.04% | 2011 | |
| GuineaGIN | 35.9% | 2012 | |
| HaitiHTI | 35.2% | 2012 | |
| TanzaniaTZA | 34.17% | 2014 | |
| KenyaKEN | 33.92% | 2009 | |
| CambodiaKHM | 33.9% | 2009 | |
| Kyrgyz RepublicKGZ | 33.7% | 2014 | |
| ZambiaZMB | 33.3% | 2008 | |
| TogoTGO | 33.07% | 2014 | |
| BurundiBDI | 32.4% | 2010 | |
| Congo, Rep.COG | 31.6% | 2012 | |
| AngolaAGO | 30.1% | 2001 | — |
| GeorgiaGEO | 29.9% | 2006 | — |
| KazakhstanKAZ | 29.1% | 1996 | — |
| MozambiqueMOZ | 27.7% | 2008 | |
| LesothoLSO | 27.52% | 2000 | — |
| MaliMLI | 27% | 2013 | |
| SudanSDN | 26.87% | 2014 | |
| South AfricaZAF | 26.4% | 1999 | — |
| MadagascarMDG | 24.2% | 2007 | |
| MoldovaMDA | 23% | 2009 | |
| GabonGAB | 22.6% | 2012 | — |
| PeruPER | 21.99% | 2015 | |
| Gambia, TheGMB | 21.24% | 2015 | |
| Lao PDRLAO | 19.2% | 2006 | — |
| North MacedoniaMKD | 19.2% | 2011 | |
| AlbaniaALB | 18.8% | 2005 | |
| Timor-LesteTLS | 17.7% | 2007 | |
| Bosnia and HerzegovinaBIH | 17.6% | 2000 | — |
| UkraineUKR | 16.6% | 2005 | — |
| Yemen, Rep.YEM | 15% | 2010 |
Source: World Bank (WB WDI)