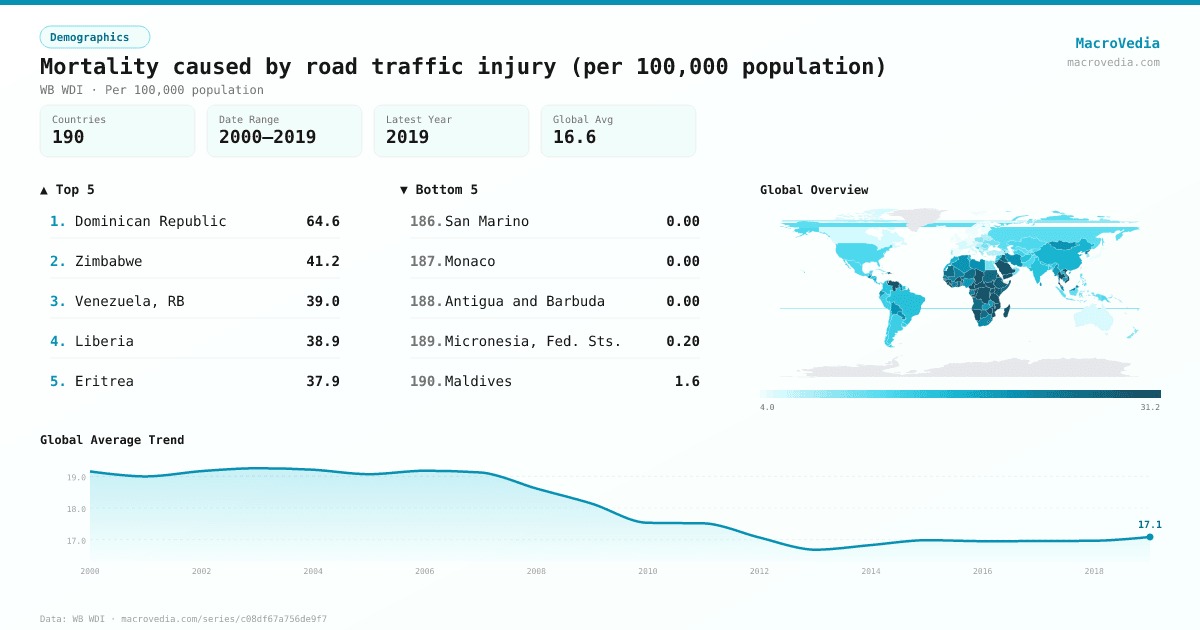
Mortality caused by road traffic injury (per 100,000 population)
DemographicsWB WDIwb_wdi:SH.STA.TRAF.P5•Per 100,000 population•2000 → 2019•190 countries
Series quick facts
High-level context for this country series.
DemographicsWB WDI
Coverage
190
Frequency
yearly
Range
2000 \u2192 2019
Latest
2019
Mortality caused by road traffic injury (per 100,000 population) by country
Latest available value per country (as of 2019)
Low \u2192 High
Unit: Per 100,000 population
≤ 5.1
5.1 – 8.2
8.2 – 12.7
12.7 – 16.4
16.4 – 22.7
22.7 – 29.6
> 29.6
No data
Generated by MacroVedia.comSource: World Bank (WB WDI)
Highest 15 countries
Mortality caused by road traffic injury (per 100,000 population)
50 countries with data
Generated by MacroVedia.comSource: World Bank (WB WDI)
Distribution across countries
Mortality caused by road traffic injury (per 100,000 population)
Countries
50
Median
29.8
Mean
31.3
25th pctl
27.3
75th pctl
33.4
Generated by MacroVedia.comSource: World Bank (WB WDI)
Compare trends
Mortality caused by road traffic injury (per 100,000 population)
Dominican RepublicZimbabweVenezuela, RB
Generated by MacroVedia.comSource: World Bank (WB WDI)
| Country | Latest | Date | Trend |
|---|---|---|---|
| Dominican RepublicDOM | 64.6 Per 100,000 population | 2019 | |
| ZimbabweZWE | 41.2 Per 100,000 population | 2019 | |
| Venezuela, RBVEN | 39 Per 100,000 population | 2019 | |
| LiberiaLBR | 38.9 Per 100,000 population | 2019 | |
| EritreaERI | 37.9 Per 100,000 population | 2019 | |
| Central African RepublicCAF | 37.7 Per 100,000 population | 2019 | |
| South SudanSSD | 36.7 Per 100,000 population | 2019 | |
| Saudi ArabiaSAU | 35.9 Per 100,000 population | 2019 | |
| BurundiBDI | 35.5 Per 100,000 population | 2019 | |
| Congo, Dem. Rep.COD | 34.9 Per 100,000 population | 2019 | |
| NamibiaNAM | 34.8 Per 100,000 population | 2019 | |
| EswatiniSWZ | 33.5 Per 100,000 population | 2019 | |
| MalawiMWI | 33.4 Per 100,000 population | 2019 | |
| Sierra LeoneSLE | 33 Per 100,000 population | 2019 | |
| TongaTON | 33 Per 100,000 population | 2019 | |
| ChadTCD | 32.4 Per 100,000 population | 2019 | |
| Guinea-BissauGNB | 32.2 Per 100,000 population | 2019 | |
| ThailandTHA | 32.2 Per 100,000 population | 2019 | |
| LesothoLSO | 31.9 Per 100,000 population | 2019 | |
| TanzaniaTZA | 31.1 Per 100,000 population | 2019 | |
| Burkina FasoBFA | 31 Per 100,000 population | 2019 | |
| Viet NamVNM | 30.6 Per 100,000 population | 2019 | |
| CameroonCMR | 30.2 Per 100,000 population | 2019 | |
| MozambiqueMOZ | 30 Per 100,000 population | 2019 | |
| St. LuciaLCA | 29.8 Per 100,000 population | 2019 | |
| Congo, Rep.COG | 29.7 Per 100,000 population | 2019 | |
| GuineaGIN | 29.7 Per 100,000 population | 2019 | |
| Gambia, TheGMB | 29.6 Per 100,000 population | 2019 | |
| RwandaRWA | 29.4 Per 100,000 population | 2019 | |
| UgandaUGA | 29.4 Per 100,000 population | 2019 | |
| Yemen, Rep.YEM | 29.4 Per 100,000 population | 2019 | |
| MadagascarMDG | 29.2 Per 100,000 population | 2019 | |
| TogoTGO | 28.7 Per 100,000 population | 2019 | |
| KenyaKEN | 28.3 Per 100,000 population | 2019 | |
| EthiopiaETH | 28.2 Per 100,000 population | 2019 | |
| Sao Tome and PrincipeSTP | 27.9 Per 100,000 population | 2019 | |
| Somalia, Fed. Rep.SOM | 27.4 Per 100,000 population | 2019 | |
| IraqIRQ | 27.3 Per 100,000 population | 2019 | |
| Equatorial GuineaGNQ | 27.2 Per 100,000 population | 2019 | |
| BeninBEN | 26.8 Per 100,000 population | 2019 | |
| Cabo VerdeCPV | 26.8 Per 100,000 population | 2019 | |
| SudanSDN | 26.8 Per 100,000 population | 2019 | |
| ComorosCOM | 26.6 Per 100,000 population | 2019 | |
| BotswanaBWA | 26.4 Per 100,000 population | 2019 | |
| AngolaAGO | 26.1 Per 100,000 population | 2019 | |
| GhanaGHA | 25.7 Per 100,000 population | 2019 | |
| MauritaniaMRT | 25.6 Per 100,000 population | 2019 | |
| NigerNER | 25.5 Per 100,000 population | 2019 | |
| Korea, Dem. People's Rep.PRK | 24.2 Per 100,000 population | 2019 | |
| Cote d'IvoireCIV | 24.1 Per 100,000 population | 2019 |
Source: World Bank (WB WDI)