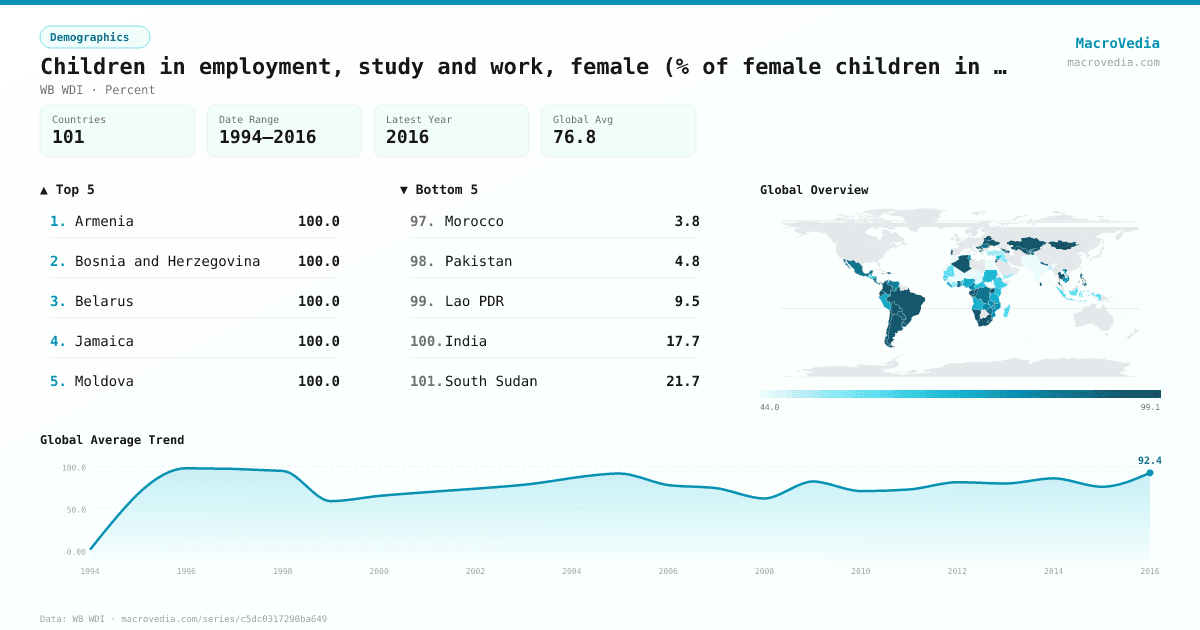
Children in employment, study and work, female (% of female children in employment, ages 7-
DemographicsWB WDIwb_wdi:SL.TLF.0714.SW.FE.ZS•Percent•1994 → 2016•101 countries
Series quick facts
High-level context for this country series.
DemographicsWB WDI
Coverage
101
Frequency
—
Range
1994 \u2192 2016
Latest
2016
Children in employment, study and work, female (% of female children in employment, ages 7- by country
Latest available value per country (as of 2016)
Low \u2192 High
Unit: %
≤ 51.59%
51.59% – 68.53%
68.53% – 81.34%
81.34% – 88.81%
88.81% – 94.26%
94.26% – 98.43%
> 98.43%
No data
Generated by MacroVedia.comSource: World Bank (WB WDI)
Highest 15 countries
Children in employment, study and work, female (% of female children in employment, ages 7-
50 countries with data
Generated by MacroVedia.comSource: World Bank (WB WDI)
Distribution across countries
Children in employment, study and work, female (% of female children in employment, ages 7-
Countries
50
Median
94.9%
Mean
94.9%
25th pctl
92.4%
75th pctl
98.9%
Generated by MacroVedia.comSource: World Bank (WB WDI)
Compare trends
Children in employment, study and work, female (% of female children in employment, ages 7-
BrazilKyrgyz RepublicMongolia
Generated by MacroVedia.comSource: World Bank (WB WDI)
| Country | Latest | Date | Trend |
|---|---|---|---|
| ArmeniaARM | 100% | 2010 | — |
| Bosnia and HerzegovinaBIH | 100% | 2006 | |
| BelarusBLR | 100% | 2012 | — |
| JamaicaJAM | 100% | 2011 | — |
| MoldovaMDA | 100% | 2009 | |
| SerbiaSRB | 100% | 2014 | |
| Trinidad and TobagoTTO | 100% | 2006 | |
| ChileCHL | 99.8% | 2012 | |
| UkraineUKR | 99.7% | 2012 | — |
| Kyrgyz RepublicKGZ | 99.66% | 2014 | |
| MongoliaMNG | 99.13% | 2013 | |
| Dominican RepublicDOM | 98.91% | 2014 | |
| GeorgiaGEO | 98.9% | 2006 | — |
| Sri LankaLKA | 98.71% | 2009 | |
| GabonGAB | 98.47% | 2012 | — |
| EswatiniSWZ | 98.32% | 2010 | |
| JordanJOR | 97.97% | 2016 | |
| UzbekistanUZB | 97.9% | 2005 | |
| North MacedoniaMKD | 97.76% | 2011 | — |
| KazakhstanKAZ | 97.7% | 2006 | |
| ThailandTHA | 96.5% | 2005 | — |
| BrazilBRA | 96.36% | 2015 | |
| PortugalPRT | 96.34% | 2001 | — |
| ArgentinaARG | 95.21% | 2012 | — |
| Congo, Rep.COG | 94.9% | 2012 | — |
| AlgeriaDZA | 94.87% | 2013 | — |
| EcuadorECU | 94.62% | 2015 | |
| South AfricaZAF | 94.5% | 1999 | — |
| BoliviaBOL | 94.32% | 2015 | |
| ColombiaCOL | 94.21% | 2015 | |
| ParaguayPRY | 94% | 2014 | |
| UgandaUGA | 93.93% | 2012 | — |
| AlbaniaALB | 93.76% | 2010 | |
| AzerbaijanAZE | 93.7% | 2005 | |
| NamibiaNAM | 93.64% | 1999 | — |
| MalawiMWI | 92.9% | 2015 | |
| HaitiHTI | 92.46% | 2012 | — |
| UruguayURY | 92.36% | 2009 | — |
| PhilippinesPHL | 91.7% | 2011 | |
| PanamaPAN | 91.07% | 2014 | |
| LesothoLSO | 89.86% | 2000 | — |
| NepalNPL | 89.79% | 2014 | |
| El SalvadorSLV | 89.11% | 2013 | |
| GhanaGHA | 88.76% | 2012 | |
| ZimbabweZWE | 88.6% | 1999 | — |
| TajikistanTJK | 87.9% | 2005 | — |
| MexicoMEX | 87.61% | 2013 | |
| Costa RicaCRI | 86.79% | 2016 | |
| Congo, Dem. Rep.COD | 86.69% | 2014 | |
| NicaraguaNIC | 86.25% | 2012 |
Source: World Bank (WB WDI)